Visualising ConAir data with Cubism.js
This post is part of a series of blog posts detailing how I built a system which records the temperature in our office. The parts are as follows:
- Measuring temperature with an Arduino describes how to use an Arduino and a thermistor to record the temperature.
- ConAir gives an overview of the motivation behind the project, and runs through the process of taking the readings from the arduino and publishes them to a TempoDB database on the internet.
- This post describes building a proxy webservice for the TempoDB database, and then visualising the temperature data using cubism.js
- iOS App describes building an iOS app which pulls the data from the webservice created in this app and uses ShinobiCharts to plot the result.
Hot on the tail of being able to record temperature readings from the Arduino in the office, we can get some charting on the go.
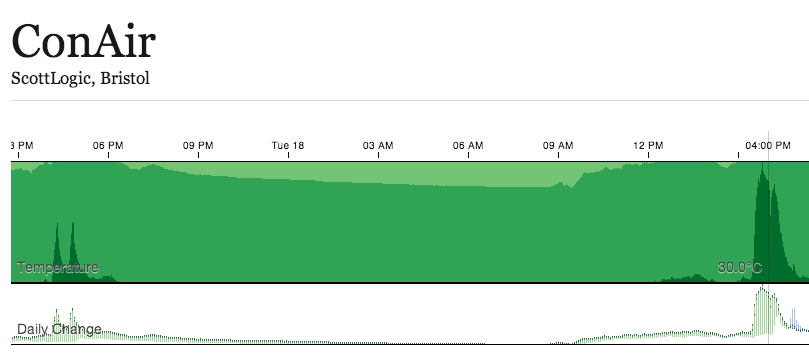
This post describes building a cubism.js front end to a TempoDB API proxy we implement in Sinatra. You can see the result running live on heroku at sl-conair, and there’s a screenshot below in case we’re working on the electronics and there is no data:
We have been using TempoDB to store the temperature data points - it has a great API for querying your dataset, including rollups, which are able to summarise your data at a resolution of your choice. Unfortunately, TempoDB doesn’t yet allow public access to datasets - the API requires authentication for both read and write. Therefore the first part of this stage will be to build a proxy for the TempoDB API. We then use Cubism.js to interface this proxied API.
TempoDB Proxy
TempoDB provide a selection of API clients - we used the python one to upload the data points as they are read off the Arduino. Here I’m going to use the Ruby one - just ‘cos.
The following is part of a really simple Sinatra application which will interface with the TempoDB API.
We receive requests for data on /data with URL parameters start, stop and
step. The two timestamps are in a format which can be parsed by ruby’s Time.parse
method, whilst the step is measured in milliseconds. This is to fit nicely with
Cubism.js.
We convert the step into a string of a suitable format for the TempoDB client, here, assuming that the step will always be an integer number of minute. We then send the request to TempoDB.
As mentioned before, if you ask for data at a coarser level than that at which it was recorded, TempoDB will “roll” it up for you. This is a fantastic feature, and although the logic to perform this kind of operation isn’t complex, this kind of operation can absorb days worth of optimisation time, combined with the fiddling associated with working with date objects. Here, we are telling TempoDB that the rollup function should be mean, although other sensible collection operators are implemented too (e.g. count, sum, max etc).
Discontinuous Data
If there is a discontinuity in your data, then TempoDB won’t perform any interpolation - there will be gaps in what it returns. This is fine because the data it returns consists of timestamp-value pairs.
This does however present an issue with Cubism.js, which doesn’t expect discontinuities in the data, and in fact only works with an array of values, ignoring timestamps.
Therefore we iterate through the array of datapoints returned by TempoDB and if there is a temporal discontinuity, we interpolate suitable values. In this instance we’ve chosen to linearly interpolate between the points either side of the discontinuity.
if((next_time - current_time - step / 1000).abs > 5)
  # Let's add the right number of values
  points_needed = ((next_time - current_time) / (step / 1000)).floor
  difference = data[index+1].value - val.value
  points_needed.times { |i| response_data.push({ value: (val.value + difference * i / points_needed.to_f) }) }
end
This particular endpoint will return a JSON array of hashes, each containing a value key. The array will be in time order, and the elements represent consecutive temperature readings, at the specified time interval, from start to stop.
Cubism.js
Cubism is a time-series visualisation tool built on top of the brilliant d3.js javascript library. d3.js works on the paradigm of data driven websites - where the content and the style changes as events occur within the data - whether it be a user interacting with it, or new data points arriving. There are some awesome d3.js demos on their website with fantastic visualisations - easily a way to waste an hour…
Cubism.js is a library developed by the people at square for displaying just this kind of data. We are going to use it to call our new API proxy.
Start with a div, within which we will place the chart:
<div id="chart"></div>Cubism has the concept of a context, which manages the data requests and the UI elements.
var context= cubism.context()
    .serverDelay(2 * 60 * 1000) // Allow 2 mins server delay
    .step(2 * 60 * 1000) // Every 2 mins
    .size(940)
The serverDelay specifies how long a delay we are prepared to wait before
querying the server for new data points, step defines how many milliseconds
you wish to wait between datapoints and size determines how many datapoints
(and therefore the width in pixels) you wish the chart to display.
Cubism manages the requests for the data points given the above settings, and a data source. It has built-in datasource types for Cube and Graphite, but we need to create our own:
var primary = temperature(),
    esecondary = primary.shift(- 24 * 60 * 60 * 1000);

function temperature() {
  return context.metric(function(start, stop, step, callback) {
    d3.json("/data/?start=" + start.toISOString()
      + "&stop=" + stop.toISOString()
      + "&step=" + step, function(data) {
        if(!data) return callback(new Error("unable to load data"));
        callback(null, data.map(function(d) { return d.value; }));
      });
  });
}
We have defined 2 metrics - the second of them simply a time-shifted version of the first. This is the simple kind of metric calculations provided by cubism, and we’ll use this in the difference chart.
The temperature() function returns a context metric, which describes
how cubism should request data given start, stop and step values, and then
returns the data with a node.js inspired callback method. It’s all pretty
straightforward - we just plug in our particular API URL and then make sure
we process the results to pass an array of numerical values to the callback function.
That’s all the data handling work done. Now we just need to sort the GUI.
d3.select("#chart").call(function(div) {
    div.append("div")
      .attr("class", "axis")
      .call(context.axis().orient("top"));

    div.selectAll(".horizon")
      .data([primary])
      .enter().append("div")
      .attr("class", "horizon")
      .call(context.horizon()
        .height(120)
        .format(d3.format(".2f"))
        .title("Temperature"));

    div.selectAll(".comparison")
      .data([[primary, secondary]])
      .enter().append("div")
      .attr("class", "comparison")
      .call(context.comparison()
        .height(60)
        .formatChange(d3.format(".1f%"))
        .title("Daily Change"));

    div.append("div")
      .attr("class", "rule")
      .call(context.rule());
});

context.on("focus", function(i) {
    format = d3.format(".1f");
    d3.selectAll(".horizon .value").style("right", i== null ? null : context.size() - i + "px")
      .text(format(primary.valueAt(Math.floor(i))) + "\u00B0C");
});
This code first find the div we defined beforehand, adds an axis to the top of it, adds a horizon chart and a comparison chart and a rule which follows the cursor over the map.
The last block updates the value display to follow the rule.
Lots more info on setting this up is available on the cubism site, and there are plenty of demos to hack around with.
Et voila…
After all that work, you probably want to see it. You can check the current graph at the site I’ve popped up on heroku sl-conair. Be warned that this project is a work in progress - we’ve got loads we want to do with the electronics, the data collection and the frontend, so it’s quite likely that there will be gaps in the data.
Hope that was of interest. I still want to post about the electronics side of this project - hopefully I’ll get round to that soon
sx
Edit (11/02/2013)
Added an additional introduction to pull together the ConAir posts.