ConAir: The quest for reasonable office air con
We’re all pretty genial people in our office, however, together with car parking, one of the topics that is always likely to get a response is the air conditioning. It’s a regular occurrence for people to be sat coding in their coats, but equally the meeting cupboard suffers from what can only be described as sauna-like properties.
I decided that I needed to buy a thermometer. I find that life is better with more data, and that we would all feel a lot better with some facts to backup our complaints.
Why buy a thermometer, when you can make one?
I didn’t really want to just measure the temperature, I wanted to chart it. I wanted a chart of the temperature in lots of different places, all the time. I didn’t want to spend all day typing readings into a spreadsheet, so I needed to log it automatically. I needed an Arduino. Luckily my colleague had one - I ordered a thermistor and we were away.
Electronics
The Arduino board we have has 5 analog input pins, the voltage of which is sampled with an ADC (Analog to Digital Convertor) and can then be written our via a serial port. I’ll do another blog with more detail of the electronics - including the Arduino code. There’s a pretty good tutorial on Adafruit.
Let’s get this into Python
Python is a great language for this kind of work. The electronics setup resulted in an arduino pushing the ADC value from across the thermistor (in a potential divider setup) to the serial port every 3 seconds. The line we’re interested in looks like:
sensorValue: 453
Python’s PySerial is a library for reading from the serial port. Install it:
$ pip install pyserial
The following code uses PySerial to open the serial port, before listening as lines arrive. When a line arrives, it checks whether it is of the right format, and if it is, then pull off the value and print it out.
import serial
ser = serial.Serial('/dev/tty.usbserial-A800etDk', 9600)
while 1:
    r = ser.readline()
    split = r.split(": ")
    if split[0] == "sensorValue":
        value = split[1].strip()
        print value
These sensor values measure the potential across the thermistor, and is a 10-bit measurement as a proportion of the board’s power supply. This means that the maximum reading is 1023, and this corresponds to a potential of that of the power supply - which should be 5V. We need to convert this into the resistance of the thermistor, and then on to a temperature. We use the following python method:
POTENTIAL_DIVIDER_RESISTOR = 10000
THERMISTOR_B_VALUE = 3977
THERMISTOR_REF_TEMP = 298.15
THERMISTOR_REF_RESISTANCE = 10000

import math

def calculateTemp(value):
    voltage = float(value) / 1024 * 5
    resistance = POTENTIAL_DIVIDER_RESISTOR / (5 / voltage - 1)
    temperature = 1 / (1/THERMISTOR_REF_TEMP + math.log(resistance / THERMISTOR_REF_RESISTANCE) / THERMISTOR_B_VALUE)
    print "Temperature is: %f K (%f degC)" % (temperature, temperature - 273.15)
    return temperature - 273.15
All the temperature calculations are performed in Kelvin, and the function returns the temperature in degrees centigrade. This calculation assumes that the thermistor is on the ground side of the potential divider. The constants are all from a datasheet.
Creating a Time Series
Now we’ve got the temperature calculations working, we need to come up with somewhere to save them. Fortunately there is what looks to be a perfect cloud-based solution for this, in TempoDB. TempoDB is an alumnus of the inaugural class of TechStars, and is based in Chicago. It offers a simple API for exactly this kind of data - time series.
They have a nice python client to install
$ pip install tempodb
And then it’s pretty simple to set up some code to post readings:
from tempodb import Client, DataPoint

client = Client('your-api-key', 'your-api-secret')
while 1:
    r = ser.readline()
    split = r.split(": ")
    if split[0]  == "sensorValue":
        value = split[1].strip()
        temp = calculate_temp(value)
        client.write_key("temperature", [DataPoint(datetime.datetime.now(), temp)])
Since the Arduino is going to be taking readings every 3 seconds, this is going to result in rather a lot of data, so in the final version we add an array to buffer 20 such readings, and therefore post the mean of each minute:
Man, our office gets warm
So, the result of all this, is a nice graph, of temperature over time for the first day of operation. This is the chart provided by TempoDB by default - it’s on our todo list to improve the charting using our own front end, but this is a cool result for not much work at all.
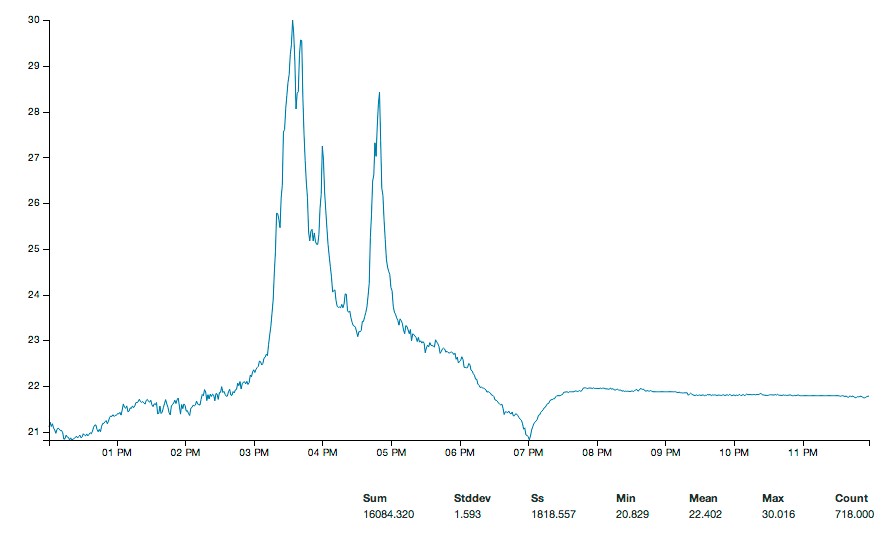
It’s pretty easy to see when the sun came out (at this stage the thermistor is just sat on my desk next to the window) and also when the aircon turned off for the weekend.
Conclusions
This was a lot more fun than just buying a thermometer, and there’s so much more to do:
- I’ve got a humidity sensor as well, so once I’ve built the circuitry for that then we’ll be adding another series to this dataset.
- d3.js is an amazing data-driven javascript utility. I want to learn how to use it so will be plotting this data using that, in a place everybody can access it.
- We want to do some calibration, and are hoping to be able to spot the phase change temperature plateau as ice melts.
TempoDB seems really cool - I’m looking forward to putting it through its paces as we start to collect more time series data.