Building a range selector with ShinobiCharts: Part IV - Adding a value-tracking annotation
This tutorial is also available on the ShinobiControls blog. You’ll find better support and assistance on this site as part of ShinobiDeveloper
Welcome to the fourth (and probably final) post in my series about building a range selector using ShinobiCharts for iOS. If you haven’t already read the previous parts then it might be worth a look to describe how we got to where we are now (part I, part II, part III).
In this post we’re going to look at a couple of things:
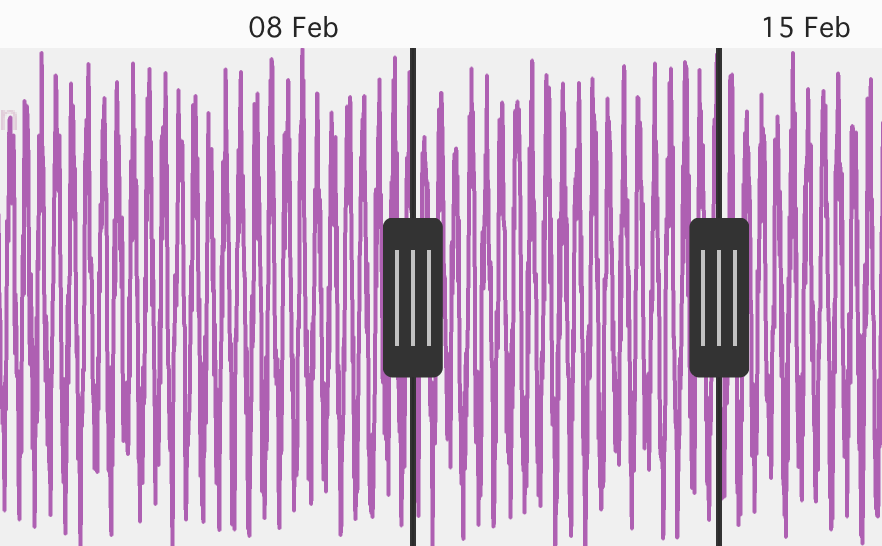
- When we first start the app the range selector should be showing a default range. At the moment it shows the entire range as being selected, but this isn’t ideal. We’ll look at how to specify an initial range.
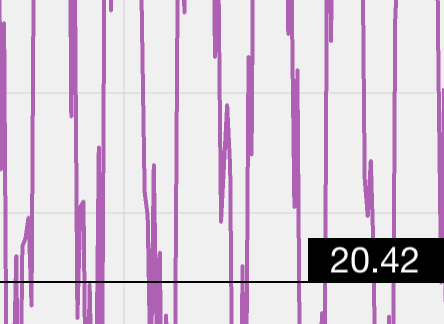
- We’re going to add a value annotation, which displays the value of the right-most
datapoint visible on the chart. This will take the form of a horizontal line
across the chart with a text label at the right hand side:
This part of the tutorial describes the more recent commits in the GitHub repository available at github.com/sammyd/Shinobi-RangeSelector. You can check out the code there as a fully-working demo app, or just follow along with the code we develop in tutorial.
Initial Range Selection
When we first start the app, the visible range on the chart is by default the entire data range, and consequently it’s not obvious that there even is a range selector. We’re going to add a simple call on to the end of the range selector’s constructor to a new method:
- (id)initWithFrame:(CGRect)frame
         datasource:(id<SChartDatasource, SChartDatasourceLookup>)datasource
    splitProportion:(CGFloat)proportion
{
    self = [super initWithFrame:frame];
    if (self) {
        ...
        // And now prepare the default range
        [self configureTheDefaultRange];
    }
    return self;
}
This method is going to set the initial range displayed by the range selector. Since we don’t really know anything about the data, we’ve arbitrarily chosen to display the 4th 20% of the timeline. You can see how to adapt this method to a different range, possibly even provided in the constructor of the range selector.
- (void)configureTheDefaultRange
{
    NSInteger numberPoints = [chartDatasource sChart:mainChart numberOfDataPointsForSeriesAtIndex:0];
    // Let's make the default range the 4th 20% of data points
    // NB: we're assuming here that the datapoints are in ascending order of x. This isn't
    //  always true, but it is for our data set, so we'll live with it.
    NSInteger startIndex = floor(numberPoints * 0.6);
    NSInteger endIndex = floor(numberPoints * 0.8);

    // Find the correct points
    SChartDataPoint *startPoint = [chartDatasource sChart:mainChart
                                         dataPointAtIndex:startIndex
                                         forSeriesAtIndex:0];
    SChartDataPoint *endPoint = [chartDatasource sChart:mainChart
                                       dataPointAtIndex:endIndex
                                       forSeriesAtIndex:0];

    // Need to convert the datapoints to their internal representation - i.e. time interval floats
    NSTimeInterval startTS = [((NSDate *)startPoint.xValue) timeIntervalSince1970];
    NSTimeInterval endTS = [((NSDate *)endPoint.xValue) timeIntervalSince1970];

    SChartRange *defaultRange = [[SChartRange alloc] initWithMinimum:@(startTS) andMaximum:@(endTS)];

    // And now set the default range to this range
    [mainChart.xAxis setDefaultRange:defaultRange];
    [mainChart.xAxis resetZoomLevel];

    // And update the annotation appropriately
    [rangeAnnotationManager moveRangeSelectorToRange:defaultRange];
}
This method performs the following:
- We find the start and end datapoints for our range.
- Create the
SChartRangewe wish to show. We could useNSDates here, but since when we ask the axis for the range later on we getNSNumbersback, we choose to stick to the same convention. - We set the xAxis range from our constructed range
- Update the range annotation with our constructed range.
This is all fairly simple. The only point worth making is that we use a different
SChartDatasource method to retrieve individual data points than we used before.
There are 2 different ways that a SChartDatasource can provide the data points
to a chart - either an NSArray of all the data points at once, or individually.
We have previously only implemented the array method, but here we use the single
datapoint as well. It’s simple to update the ChartDatasource to implement this
additional method:
- (id<SChartData>)sChart:(ShinobiChart *)chart
        dataPointAtIndex:(int)dataIndex
        forSeriesAtIndex:(int)seriesIndex
{
    // Find the underlying temperature data point
    TemperatureDataPoint *tdp = temperatureData.data[dataIndex];
    // Turn this into a chart data point
    SChartDataPoint *dp = [SChartDataPoint new];
    dp.xValue = tdp.timestamp;
    dp.yValue = tdp.temperature;
    return dp;
}
We find the relevant TemperatureDataPoint in our underlying data array, and then
construct an appropriate SChartDatapoint from it.
Where’s the shading gone?
There is one more slight niggle with this implementation - the initial rendering
of the range selector doesn’t properly render the shaded regions. This is because
they use the x-axis limits to work out their endpoints. Unfortunately, the axis
range hasn’t been calculated at the point where we call moveRangeSelectorToRange: in
configureTheDefaultRange.
To get around this limitation, we’re going to add another method to the API of the range selector, and set the initial limits ourselves:
...
- (void)setInitialMin:(id)min andMax:(id)max;
...
which has the following simple implementation:
- (void)setInitialMin:(id)min andMax:(id)max
{
    leftShading.xValue = min;
    rightShading.xValueMax = max;
}
Now, at the end of the configureTheDefaultRange method, we determine what the
axis limits will be (using the datasource, and once again assuming that the
datapoints will be increasing in timestamp), and set the initial range of the
range annotation:
- (void)configureTheDefaultRange
{
...
// We also want to set the min/max since it's not available from the axis yet
SChartDataPoint *minDP = [chartDatasource sChart:mainChart
dataPointAtIndex:0
forSeriesAtIndex:0];
SChartDataPoint *maxDP = [chartDatasource sChart:mainChart
dataPointAtIndex:(numberPoints-1)
forSeriesAtIndex:0];
[rangeAnnotationManager setInitialMin:minDP.xValue andMax:maxDP.xValue];
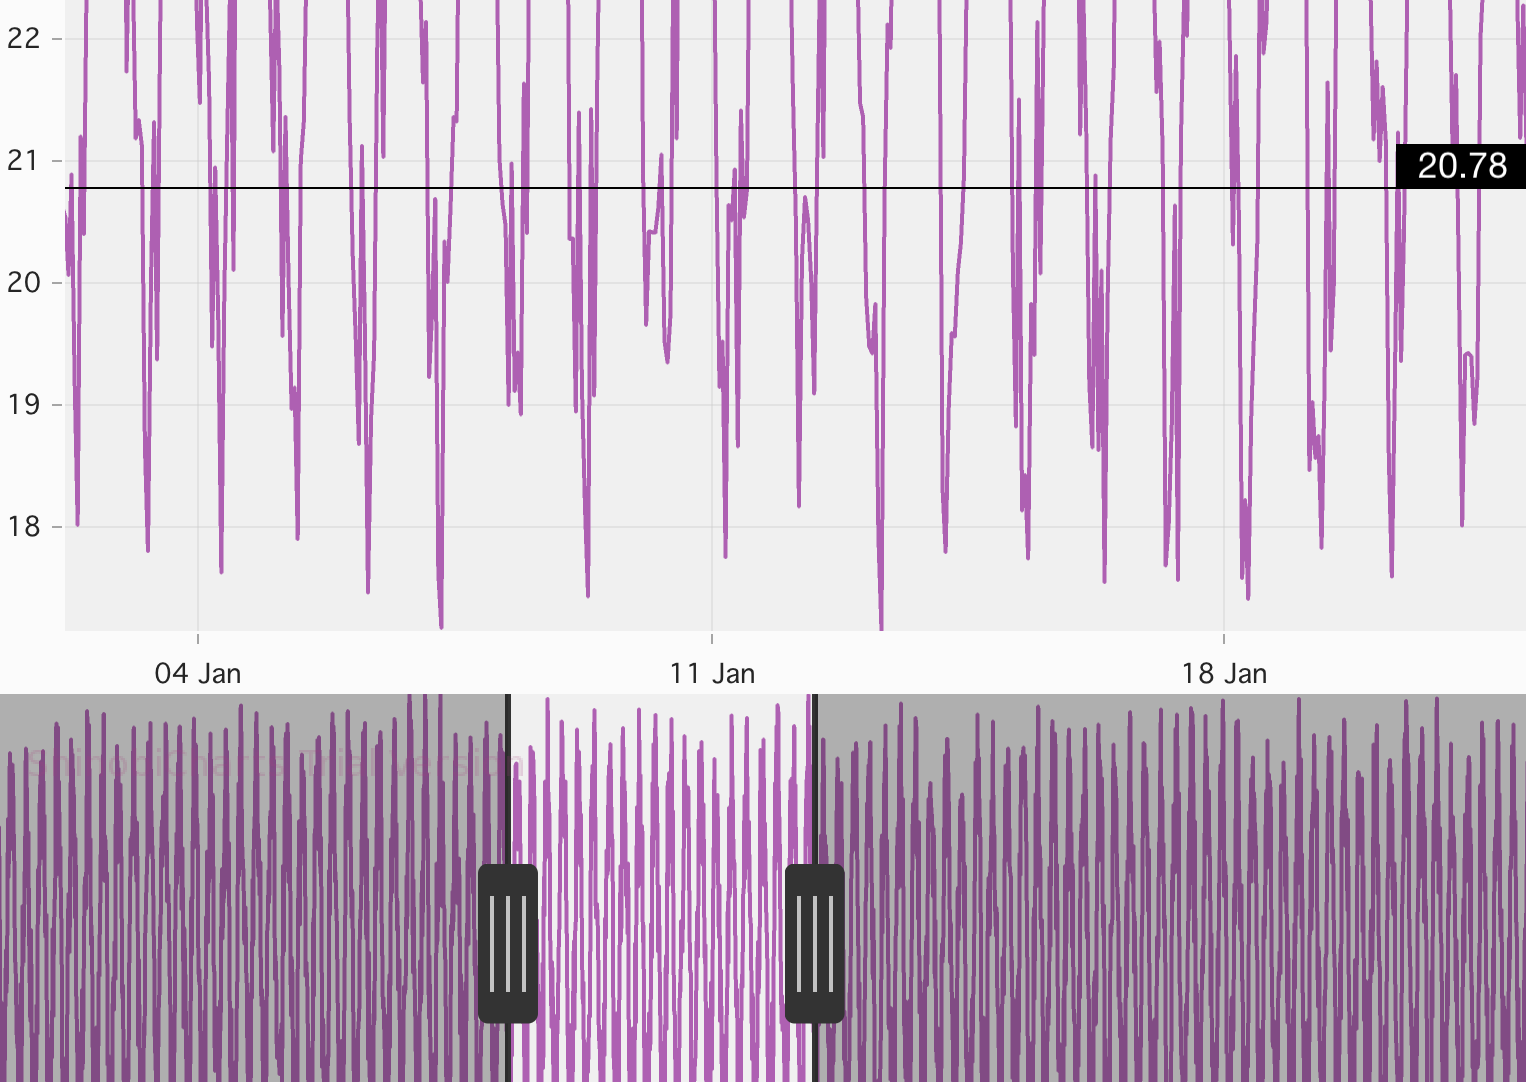
}And there - we’re done. The range selector now has a nice initial range, and it renders perfectly from the instant the chart appears.
Value Annotation
The value annotation we want to add is comprised of 2 separate parts – a horizontal line and a text annotation which is anchored to the line:
As the user interacts with the chart (either through the range annotation, or the chart itself) the position of the value annotation tracks the y-Value of the rightmost datapoint displayed on the chart. The value displayed in the text annotation will also update to show the same y-Value.
Annotation Manager
In the same way that we created a class to manage the range annotation, we’ll
create a ShinobiValueAnnotationManager class:
@interface ShinobiValueAnnotationManager : NSObject

- (id)initWithChart:(ShinobiChart *)chart
         datasource:(id<SChartDatasourceLookup>)datasource
        seriesIndex:(NSInteger)seriesIndex;

- (void)updateValueAnnotationForXAxisRange:(SChartRange *)range;

@end
There are just 2 methods on the API of this manager class - the first one a constructor, and the second the method which will update the value annotation as the chart pans and zooms. Two of the variables provided to the constructor are self explanatory, but the datasource is an object which conforms to an as-yet undefined protocol. We’ll come back to explaining this later, once we’ve finished discovered why it is necessary.
In the implementation file for this class we define some ivars and the constructor as follows:
@interface ShinobiValueAnnotationManager () {
    ShinobiChart *chart;
    id<SChartDatasourceLookup> datasource;
    NSInteger seriesIndex;
    SChartAnnotation *lineAnnotation;
    SChartAnnotation *textAnnotation;
}

@end

@implementation ShinobiValueAnnotationManager
- (id)init
{
    NSException *exception = [NSException exceptionWithName:NSInvalidArgumentException
                                                     reason:@"Please use initWithChart:seriesIndex:"
                                                   userInfo:nil];
    @throw exception;
}

- (id)initWithChart:(ShinobiChart *)_chart
         datasource:(id<SChartDatasourceLookup>)_datasource
        seriesIndex:(NSInteger)_seriesIndex
{
    self = [super init];
    if (self) {
        chart = _chart;
        seriesIndex = _seriesIndex;
        datasource = _datasource;
        [self createLine];
        [self createText];
    }
    return self;
}
@end
We have ivars for the 2 separate annotations which make up the value annotation (the text component and the line component), along with 3 ivars for the variables we provide in the constructor. The constructor saves these off, and then calls some utility methods which will create the annotations. Note that we have also overridden the default constructor to throw and exception, since we require the usage of our own constructor.
To create the individual annotations we use the utility methods createLine and
createText.
@implementation ShinobiValueAnnotationManger
...
- (void)createLine
{
    // Really simple line
    lineAnnotation = [SChartAnnotation horizontalLineAtPosition:nil
                                                      withXAxis:chart.xAxis
                                                       andYAxis:chart.yAxis
                                                      withWidth:1.f
                                                      withColor:[UIColor blackColor]];
    [chart addAnnotation:lineAnnotation];
}

- (void)createText
{
    // Create the font
    UIFont *labelFont = [UIFont fontWithName:@"Nunito-Bold" size:18.f];
    if(labelFont == nil) {
        labelFont = [UIFont systemFontOfSize:18.f];
    }

    // Create our text annotation subclass. We set the text to be the widest of our possible values
    //  since we only size the annotation at construction time.
    textAnnotation = [[ShinobiAnchoredTextAnnotation alloc] initWithText:@"MM.MM"
                                                                 andFont:labelFont
                                                               withXAxis:chart.xAxis
                                                                andYAxis:chart.yAxis
                                                             atXPosition:nil
                                                            andYPosition:nil
                                                           withTextColor:[UIColor whiteColor]
                                                     withBackgroundColor:[UIColor blackColor]];
    [chart addAnnotation:textAnnotation];
}
...
@end
The createLine method is self-explanatory. We simply use the appropriate
factory method provided by the SChartAnnotation class, setting the appropriate
values, and then add the annotation to the chart. We don’t worry about the initial
position, since this will be set as the chart updates its position.
The createText method is a little more complicated - we don’t use an existing
factory method, but instead we have created our own SChartAnnotation subclass.
You might be surprised by this, since there is a factory method on SChartAnnotation
which can create a text annotation
(+ annotationWithText:andFont:withXAxis:andYAxis:atXPosition:
andYPosition:withTextColor:withBackgroundColor:), however there is a reason behind this.
The factory method creates an annotation
which is anchored with the centre-point at the x/y coordinates provided, however
we need to be able to position the bottom right corner of the annotation at the
coordinates we provide, since we are placing it on the right hand edge of the chart.
Custom Text Annotation
The ShinobiAnchoredTextAnnotation class is a pretty simple subclass of
SChartAnnotation:
@interface ShinobiAnchoredTextAnnotation : SChartAnnotation

 - (id)initWithText:(NSString*)text
            andFont:(UIFont*)font
          withXAxis:(SChartAxis*)xAxis
           andYAxis:(SChartAxis*)yAxis
        atXPosition:(id)xPosition
       andYPosition:(id)yPosition
      withTextColor:(UIColor*)textColor
withBackgroundColor:(UIColor*)bgColor;

@end
The only API method is a constructor which mirrors exactly the aforementioned factory method for creating a text annotation.
@implementation ShinobiAnchoredTextAnnotation

- (id)initWithText:(NSString *)text andFont:(UIFont *)font withXAxis:(SChartAxis *)xAxis
          andYAxis:(SChartAxis *)yAxis atXPosition:(id)xPosition andYPosition:(id)yPosition
     withTextColor:(UIColor *)textColor withBackgroundColor:(UIColor *)bgColor
{
    self = [super init];
    if(self) {
        // Set all the required properties
        self.xAxis = xAxis;
        self.yAxis = yAxis;
        self.xValue = xPosition;
        self.yValue = yPosition;
        self.label = [[UILabel alloc] initWithFrame:self.bounds];
        self.label.backgroundColor = bgColor;
        self.label.font = font;
        self.label.textColor = textColor;
        self.label.text = text;
        self.label.textAlignment = NSTextAlignmentCenter;
        // Now we can resize the label and ourself to fit the text provided
        [self.label sizeToFit];
        [self addSubview:self.label];
        [self sizeToFit];
    }
    return self;
}

- (void)updateViewWithCanvas:(SChartCanvas *)canvas
{
    [super updateViewWithCanvas:canvas];
    // Let's move us so we are anchored in the bottom right hand corner
    self.center = CGPointMake(self.center.x - self.bounds.size.width / 2,
                              self.center.y - self.bounds.size.height / 2);
}

@end
The constructor sets up all the appropriate properties on the underlying
SChartAnnotation, including creating a label. We also resize the label to fit
the initial supplied text, and the annotation itself to fit the label at this point.
This means that when we construct one of these annotations we need to provide some
text which will be used to create the annotation of an appropriate size. There
are alternative ways of sizing the annotation, but in this instance, we are able
to provide some text to size the annotation to at construction time.
The updateViewWithCanvas: method is a method on the superclass which we can
override to provide positioning fixes (see the API docs). In our overridden method
we simply shift the annotation up and left, with the resultant effect being
that the annotation is then anchored at the bottom right, rather than the centre.
Updating the Value Annotation
Although we have now fully described the constructor for the value annotation manager
there is one more method on the API which we haven’t discussed: updateValueAnnotationForXAxisRange:
This method is called with the updated x-axis range when the range changes - we’ll
look at where this occurs once we’ve defined the method’s implementation:
- (void)updateValueAnnotationForXAxisRange:(SChartRange *)range
{
    // The x-value at the end of the current chart range
    id newXValue = range.maximum;

    // Need to find the y-value at this point
    id lastVisibleDPValue = [datasource estimateYValueForXValue:newXValue
                                               forSeriesAtIndex:seriesIndex];

    // Update the annotations yValue and redraw the chart
    lineAnnotation.yValue = lastVisibleDPValue;
    textAnnotation.yValue = lastVisibleDPValue;
    textAnnotation.xValue = newXValue;
    textAnnotation.label.text = [NSString stringWithFormat:@"%0.2f",
                                          [lastVisibleDPValue doubleValue]];

    [chart redrawChart];
}
Most of this method is self explanatory - we start by defining what the xValue
is on the right hand side of the chart, find the yValye associated with it and
then update the annotation positions and content - in much the same way as we did
for the range annotation. There is one line in this method which requires more
explanation - that is the estimateYValueForXValue: message passed to the
datasource object. When describing the constructor of this manager class, we
glossed over the id<SChartDatasourceLookup> object we provided. We have
defined a new protocol:
@protocol SChartDatasourceLookup <NSObject>

@required
- (id)estimateYValueForXValue:(id)xValue forSeriesAtIndex:(NSUInteger)idx;

@end
This protocol defines a method which will return a Y value estimate for a given X value. It isn’t a simple lookup because the x-values we will be sending it won’t necessarily have datapoints associated with them in the datasource.
Implementing SChartDatasourceLookup
We need to implement this new protocol on our current chart datasource object
to enable it to be used in the value annotation. Firstly we specify that
ChartDatasource adopts the SChartDatasourceLookup protocol:
@interface ChartDatasource : NSObject <SChartDatasource, SChartDatasourceLookup>

@end
And then we need to implement the single required method:
#pragma mark - SChartDatasourceLookup methods
- (id)estimateYValueForXValue:(id)xValue forSeriesAtIndex:(NSUInteger)idx
{
    if([xValue isKindOfClass:[NSNumber class]]) {
        // Need it to be a date since we are comparing timestamp
        xValue = [NSDate dateWithTimeIntervalSince1970:[xValue doubleValue]];
    }
    NSArray *xValues = [temperatureData.data valueForKeyPath:@"@unionOfObjects.timestamp"];
    NSUInteger index = [xValues indexOfBiggestObjectSmallerThan:xValue
                                                  inSortedRange:NSMakeRange(0, xValues.count)];
    return ((TemperatureDataPoint*)temperatureData.data[index]).temperature;
}
This implementation performs the following operations:
- We firstly make sure that we have been passed an object
of the correct type. We know that our x-values are timestamps, and are instances
of
NSDate, however anSChartAxisreturns its range withNSNumbertypes, where the number represents the time interval since epoch. Therefore we perform a simple type conversion to allow comparison with our source data. - Construct an
NSArrayof all the x-values. With our data this can be achieved by collecting thetimestampproperty from each data object. - Now we search the x value array to find the index of the largest timestamp
smaller than the limit we have been provided. We do this with a method we’ve added
to
NSArrayvia a category. We won’t go into great detail here about how it works – the code is available in the repository if you wish to look it up. Note that this assumes that the array of x-values is sorted with ascending order. - Once we have this index we lookup the associated y-value (temperature) and return it.
Wiring it all up
We’ve now finished all the clever code - it just remains to wire it all up.
The ShinobiRangeSelector constructor now requires that the datasource object
conform to our new protocol, so we update as follows:
@interface ShinobiRangeSelector : UIView <SChartDelegate>

- (id)initWithFrame:(CGRect)frame
         datasource:(id<SChartDatasource, SChartDatasourceLookup>)datasource
    splitProportion:(CGFloat)proportion;

@end
and in the implementation file:
@interface ShinobiRangeSelector () <ShinobiRangeAnnotationDelegate> {
    id<SChartDatasource, SChartDatasourceLookup> chartDatasource;
    ...
}
@end

@implementation ShinobiRangeSelector
- (id)initWithFrame:(CGRect)frame
         datasource:(id<SChartDatasource, SChartDatasourceLookup>)datasource
    splitProportion:(CGFloat)proportion
{
    self = [super initWithFrame:frame];
    if (self) {
        // Initialization code
        chartDatasource = datasource;
        ...
    }
    return self;
}
...
@end
We add creation of the value annotation manager to the existing main chart initialisation method:
- (void)createMainChartWithFrame:(CGRect)frame
{
    ...
    // Add some annotations
    valueAnnotationManager = [[ShinobiValueAnnotationManager alloc] initWithChart:mainChart
                                                                       datasource:chartDatasource
                                                                      seriesIndex:0];
    ...
}
The final piece of wiring up is to ensure that the value annotation gets updated
when the user interacts with the chart - which is a matter of calling the
updateValueAnnotationForXAxisRange: method:
- (void)configureTheDefaultRange
{
    ...
    // And update the annotation appropriately
    ...
    [valueAnnotationManager updateValueAnnotationForXAxisRange:defaultRange];
}

#pragma mark - ShinobiRangeSelectorDelegate methods
- (void)rangeAnnotation:(ShinobiRangeAnnotationManager *)annotation
         didMoveToRange:(SChartRange *)range
{
    ...
    // Update the location of the annotation line
    [valueAnnotationManager updateValueAnnotationForXAxisRange:range];
    [mainChart redrawChart];
}


#pragma mark - SChartDelegate methods
- (void)sChartIsPanning:(ShinobiChart *)chart withChartMovementInformation:(const SChartMovementInformation *)information
{
    [rangeAnnotationManager moveRangeSelectorToRange:chart.xAxis.axisRange];
    [valueAnnotationManager updateValueAnnotationForXAxisRange:chart.xAxis.axisRange];
}

- (void)sChartIsZooming:(ShinobiChart *)chart withChartMovementInformation:(const SChartMovementInformation *)information
{
    ...
    [rangeAnnotationManager moveRangeSelectorToRange:chart.xAxis.axisRange];
    [valueAnnotationManager updateValueAnnotationForXAxisRange:chart.xAxis.axisRange];
}
With that we’re done!
Conclusion
Well, in the space of 4 blog posts we’ve built a charting application with some really advanced functionality. We have 2 charts talking to each other with a range selector annotation which moves with momentum, along with another annotation which tracks the value of the rightmost datapoint visible on the chart.
As I mentioned at the top I’m expecting that this is last post in this blog series
- I hope you’ve got a better understanding of quite how powerful ShinobiCharts can be, and that you have got some ideas of apps of your own. If you have any questions etc then leave a comment below or hit me up on twitter: @iwantmyrealname.
Don’t forget that the source code is available on GitHub at github.com/sammyd/Shinobi-RangeSelector so you can grab it and play with it yourself. I will attempt to keep the source code up to date with new releases of ShinobiCharts, and will push any bug fixes that I find.
sx