Building a range selector with ShinobiCharts: Part II - Creating custom handle annotations
This tutorial is also available on the ShinobiControls blog. You’ll find better support and assistance on this site as part of ShinobiDeveloper
In part one, we built a simple app which drew 2 charts from the same data source, one of which allows user interaction, the other of which has an overlay which displays which region of the entire data set the main chart is currently displaying. If you haven’t read/skimmed it I reckon this post will make a lot more sense if you do that first. It’s pretty long, but is pretty approachable.
The first post laid a lot of the ground work upon which we can build cool things. We’ve got some data and some charts, and a range selector annotation. In this post we’re going to allow users to interact with the range annotation - so that dragging it will update the range displayed within the main chart. Cool, let’s get on it.
Interacting with the range selector
We have already created a class to manage the range annotation, and most of the
work we’re going to be doing will be within that class. We want to be able to get
a user to interact with annotation, and usually in iOS we’d use gesture recognisers.
Helpfully, SChartAnnotation is a subclass of UIView, so all the gesture
magic we get from iOS we can use ourselves.
Our first interaction will be the ability for a user to drag the range annotation along the range of the x-axis - using a pan gesture. The concept is simple - we will add an invisible annotation to represent the selected range, and add a gesture recogniser - however, there are a few nuances which we will have to address as we go.
Let’s get started with creating the invisible annotation:
@interface ShinobiRangeAnnotationManager () {
    ...
    SChartAnnotationZooming *rangeSelection;
}

- (void)createAnnotations
{
    ...
    // The invisible range selection
    rangeSelection = [[ShinobiRangeSelectionAnnotation alloc] initWithFrame:CGRectMake(0, 0, 1, 1) xValue:chart.xAxis.axisRange.minimum xValueMax:chart.xAxis.axisRange.maximum xAxis:chart.xAxis yAxis:chart.yAxis];

    ...
    [chart addAnnotation:rangeSelection];
}

- (void)moveRangeSelectorToRange:(SChartRange *)range
{
    ...
    rangeSelection.xValue = range.minimum;
    rangeSelection.xValueMax = range.maximum;
    ...
}
We’ve added a new ivar to keep hold of our new annotation, and then we’ve created the annotation itself. We also update the limits of the annotation in our API method which is called when the user interacts with the main chart.
You might however have noticed that we aren’t creating this annotation in the
same way we have created the lines and the shaded regions. We have instead created
our own SChartAnnotation subclass instead, and this is due to the way in which
annotations work internally.
When an annotation is created, it is generally created with a size of 1x1. Then,
when the annotations size is required to change, it has its transform property
updated with an appropriate affine transform to get it to display as required.
This works great for general annotations, but it has the side-effect that a pan
gesture recogniser won’t get triggered within it - the most you can drag is 1pt
- not enough to be recognised as a pan. Therefore we create our own subclass of
SChartAnnotationZoomingwhich will change this behaviour:
@interface ShinobiRangeSelectionAnnotation : SChartAnnotationZooming
- (id)initWithFrame:(CGRect)frame xValue:(id)xValue xValueMax:(id)xValueMax xAxis:(SChartAxis*)xAxis yAxis:(SChartAxis*)yAxis;
@end
The constructor has the arguments we need to set up the SChartAnnotationZooming
superclass, which is as expected:
@implementation ShinobiRangeSelectionAnnotation

- (id)initWithFrame:(CGRect)frame xValue:(id)xValue xValueMax:(id)xValueMax xAxis:(SChartAxis *)xAxis yAxis:(SChartAxis *)yAxis
{
    self = [super initWithFrame:frame];
    if (self) {
        // Initialization code
        self.xAxis = xAxis;
        self.yAxis = yAxis;
        self.yValue = nil;
        self.yValueMax = nil;
        self.xValue = xValue;
        self.xValueMax = xValueMax;
        self.backgroundColor = [UIColor clearColor];
    }
    return self;
}
@end
Then we need to override 2 UIView methods. setTransform: is called by the
ShinobiCharts framework when the x and y limit values associated with the
annotation are changed, or when the chart is zoomed. Only the former of these
situations applies to us here, and since we are displaying a completely transparent
view (remember it is only there as a gesture target) we prevent the transform from
being set, and instead change the frame size. This is actually really simple, and
doesn’t require any clever calculation. If we were displaying something in our
annotation, and allowing chart zooming, then we would have to think about this in
more detail, but the following is fine for now:
- (void)setTransform:(CGAffineTransform)transform
{
    // Zooming annotations usually use an affine transform to set their shape.
    //  We're going to change the frame of the annotation so that we have a
    //  suitable area to which to recognise dragging gestures.
    CGRect bds = self.bounds;
    bds.size.width *= transform.a;
    bds.size.height *= transform.d;
    self.bounds = bds;
}
The other method we override is layoutSubviews, and we do this to ensure that
the height of our annotation is the same as the y-axis. We do this in this method
to ensure that if our chart changes size then the annotation will scale vertically
as appropriate:
- (void)layoutSubviews
{
    // We force the height to be that of the y-axis itself
    CGRect bds = self.bounds;
    bds.size.height = self.yAxis.axisFrame.size.height;
    self.bounds = bds;
}
Adding gestures
Now that we’ve got our invisible annotation as a touch target, we can add the a pan gesture:
- (id)initWithChart:(ShinobiChart *)_chart
{
    self = [super init];
    if(self) {
        ...
        [self prepareGestureRecognisers];
    }
    return self;
}

- (void)prepareGestureRecognisers
{
    // We need to stop other subviews of the chart from intercepting touches
    chart.userInteractionEnabled = YES;
    for (UIView *v in chart.subviews) {
        v.userInteractionEnabled = NO;
    }
    chart.canvas.userInteractionEnabled = YES;
    for (UIView *v in chart.canvas.subviews) {
        v.userInteractionEnabled = NO;
    }
    chart.canvas.glView.userInteractionEnabled = YES;

    // Add a pan gesture recogniser for dragging the range selector
    UIPanGestureRecognizer *gestureRecogniser = [[UIPanGestureRecognizer alloc] initWithTarget:self action:@selector(handlePan:)];
    [rangeSelection addGestureRecognizer:gestureRecogniser];
}
We add a new method to the annotation manager which will create the gesture
recognisers and add them to the annotation. The last 2 lines of this
prepareGestureRecognisers method does just that - standard UIGestureRecognizer
usage. However, before that there is some more ShinobiChart internal magic.
In order that gesture recognisers work, their entire parent view hierarchy has to
have userInteractionEnabled = YES;. Because of where annotations appear within
the view hierarchy, this isn’t true by default. Therefore the first part of the
prepareGestureRecognisers method ensures that this property is set correctly
for our annotation to be able to receive gestures. Annotations appear on the
glView subview of the canvas of a chart by default, so we make sure that all
of these behave as expected. Note, in order to get access to subviews of the canvas
layer you’ll have to import the SChartCanvas header:
#import <ShinobiCharts/SChartCanvas.h>When we created the gesture, we said that the handler would be called handlePan:,
so we should implement that:
#pragma mark - Gesture events
- (void)handlePan:(UIPanGestureRecognizer*)recogniser
{
    // What's the pixel location of the touch?
    CGPoint currentTouchPoint = [recogniser locationInView:chart.canvas.glView];

    // Create the range
    SChartRange *updatedRange = [self rangeCentredOnPixelValue:currentTouchPoint.x];

    // Move the annotation to the correct location
    [self moveRangeSelectorToRange:updatedRange];
}

#pragma mark - Utility methods
- (SChartRange*)rangeCentredOnPixelValue:(CGFloat)pixelValue
{
    // Find the extent of the current range
    double range = [rightLine.xValue doubleValue] - [leftLine.xValue doubleValue];
    // Find the new centre location
    double newCentreValue = [[chart.xAxis estimateDataValueForPixelValue:pixelValue] doubleValue];
    // Calculate the new limits
    double newMin = newCentreValue - range/2;
    double newMax = newCentreValue + range/2;

    // Create the range and return it
    return [[SChartRange alloc] initWithMinimum:@(newMin) andMaximum:@(newMax)];
}
The gesture callback itself is pretty simple because we’ve farmed out the mildly-
complicated calculation to a helper method. We’ll discuss that in a sec, but first
just run through the handlePan: method. Firstly we use standard UIGestureReconizer
properties to find the pixel location of the touch in the chart’s canvas. Then,
using our helper method we find out what range this touch point should represent,
before calling our previously created method to update the range selector’s location.
We use the rangeCentredOnPixelValue: method to find where we should move the
range selector to, given that it should be centred on a particular pixel (well,
pixel x-value). Most of this is self-explanatory, apart from the line which defines
and new variable called newCentreValue. This is another little bit of Shinobi
magic, so I’ll explain this in a little more detail.
In order to convert a touch point in pixels on a chart to an underlying data point
we add a category on SChartAxis which provides a new method to perform this
calculation:
@interface SChartAxis (CoordinateSpaceConversion)
- (id)estimateDataValueForPixelValue:(CGFloat)pixelValue;
@end
The implementation of this method is as follows:
@implementation SChartAxis (CoordinateSpaceConversion)
- (id)estimateDataValueForPixelValue:(CGFloat)pixelValue
{
    // What is the axis range?
    SChartRange *range = self.axisRange;

    // What's the frame of the plot area
    CGRect glFrame = self.chart.canvas.glView.bounds;

    //
    CGFloat pixelSpan;
    if(self.axisOrientation == SChartOrientationHorizontal) {
        pixelSpan = glFrame.size.width;
    } else {
        pixelSpan = glFrame.size.height;
    }

    // Assuming that there is a linear map
    // NOTE :: This won't work for discontinuous or logarithmic axes
    return @( [range.span doubleValue] / pixelSpan * pixelValue + [range.minimum doubleValue] );
}
@end
We find the current displayed range of the axis, and the size in pixels of the chart. Provided that the axis isn’t logarithmic or discontinuous, then there is a linear relationship between the data range and the width in pixels. We simply calculate the data value using this linear relationship:
Linking back to the main chart
So now, if you fire up your app, you should have a range selector which you can drag across the range chart - pretty neat eh? But as you drag it, the main chart isn’t updated as we would expect. So let’s fix that.
We’ll create a new delegate protocol which the annotation manager will use to inform interested parties that the range annotation has moved:
@protocol ShinobiRangeAnnotationDelegate <NSObject>

@required
- (void)rangeAnnotation:(ShinobiRangeAnnotationManager*)annotation didMoveToRange:(SChartRange*)range;

@end
We’ll make our ShinobiRangeSelector adopt this protocol:
@interface ShinobiRangeSelector () <ShinobiRangeAnnotationDelegate>
@end

@implementation ShinobiRangeSelector
#pragma mark - ShinobiRangeSelectorDelegate methods
- (void)rangeAnnotation:(ShinobiRangeAnnotationManager *)annotation didMoveToRange:(SChartRange *)range
{
    [mainChart.xAxis setRangeWithMinimum:range.minimum andMaximum:range.maximum];
    [mainChart redrawChart];
}
@end
Really nice and simple - when the method is called, we update the range on the x-axis of the main chart to show the specified range, and redraw the chart.
Now we need to ensure that the delegate method is called appropriately. We add
a delegate property to the annotation manager:
@interface ShinobiRangeAnnotationManager : NSObject
@property (nonatomic, strong) id<ShinobiRangeAnnotationDelegate> delegate;
...
@end
And then add a utility method to the implementation to call the delegate method. This isn’t vital at this stage as we’re only going to call the delegate method in one place, however, in later parts of this project we’ll be adding other calls:
- (void)callRangeDidMoveDelegateWithRange:(SChartRange*)range
{
    if (self.delegate && [self.delegate respondsToSelector:@selector(rangeAnnotation:didMoveToRange:)]) {
        [self.delegate rangeAnnotation:self didMoveToRange:range];
    }
}
We call this utility method as part of handlePan:, i.e. when the pan gesture we
created before is fired:
- (void)handlePan:(UIPanGestureRecognizer*)recogniser
{
    ...
    // And fire the delegate method
    [self callRangeDidMoveDelegateWithRange:updatedRange];
}
The last thing to do (actually, the thing I always forget to do when creating delegates) is to make sure that the have assigned the delegate property on the annotation manager when we create it:
- (void)createRangeChartWithFrame:(CGRect)frame
{
    ...
    rangeAnnotationManager.delegate = self;
    ...
}
Since we’ve already implemented the required delegate methods, when we fire the app up now, we should have the behaviour we wanted - when you drag the range selector, the main chart scrolls with you. That’s really cool, but we’re not done yet…
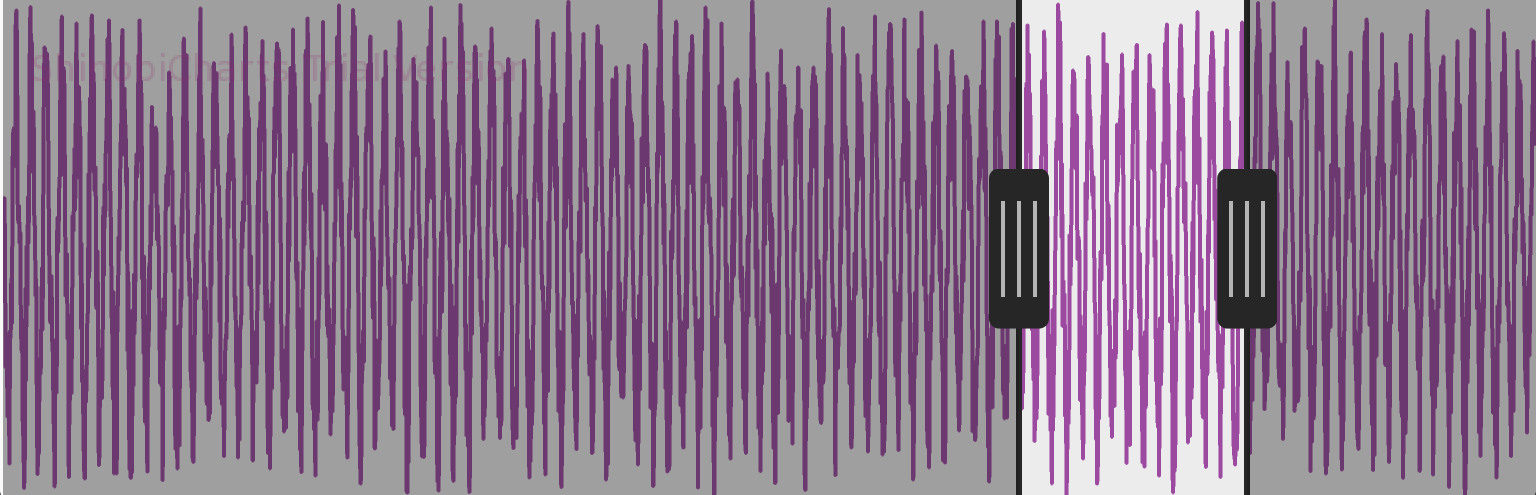
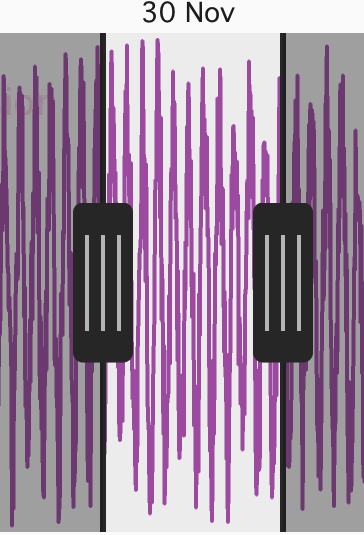
Adding handles to the range selector
Although we can pan the range selector, ideally we would be able to change the length of the selection as well. To do this we’ll add some handle annotations to the ends of the range selector, and add gesture recognisers to them, so that the user can grab hold of one of them and drag it to change the end point of the range.
We’ll create the handle as a custom SChartAnnotation subclass:
@interface ShinobiRangeHandleAnnotation : SChartAnnotation
- (id)initWithFrame:(CGRect)frame colour:(UIColor*)colour xValue:(id)xValue xAxis:(SChartAxis *)xAxis yAxis:(SChartAxis*)yAxis;
@end
In a similar way to the previous custom annotation we made we create a constructor which then sets all the required properties:
@implementation ShinobiRangeHandleAnnotation

- (id)initWithFrame:(CGRect)frame colour:(UIColor *)colour xValue:(id)xValue xAxis:(SChartAxis *)xAxis yAxis:(SChartAxis *)yAxis
{
    self = [super initWithFrame:frame];
    if (self) {
        // Initialization code
        self.xAxis = xAxis;
        self.yAxis = yAxis;
        self.xValue = xValue;
        // Setting this to nil will ensure that the handle appears in the centre
        self.yValue = nil;

        [self drawHandleWithColour:colour];
    }
    return self;
}
@end
The only interesting part of this is that setting the yValue property to nil
will ensure that the handle will be drawn vertically centred - which is perfect
for our purposes. We have defined a custom method drawHandleWithColour: which
actually creates the handle:
- (void)drawHandleWithColour:(UIColor *)colour
{
    self.layer.cornerRadius = 5;
    self.backgroundColor = colour;

    // Add 3 lines
    int numberLines = 3;
    CGFloat lineWidth = 2;
    CGFloat lineSpacing = (self.frame.size.width - lineWidth * numberLines) / (numberLines + 1);
    CGFloat heightProportion = 0.6;
    CGFloat lineHeight = heightProportion * self.frame.size.height;
    CGFloat lineY = (1-heightProportion) / 2 * self.frame.size.height;
    CGFloat currentOffset = lineSpacing;
    for(int i=0; i<numberLines; i++) {
        UIView *newLine = [[UIView alloc] initWithFrame:CGRectMake(currentOffset, lineY, lineWidth, lineHeight)];
        newLine.backgroundColor = [UIColor colorWithWhite:1.f alpha:0.7f];
        [self addSubview:newLine];
        currentOffset += (lineWidth + lineSpacing);
    }
}
This is all standard UIView code. In order to set the corners to be rounded
you need to have imported QuartzCore.h:
#import <QuartzCore/QuartzCore.h>We do some trivial calculations to draw 3 evenly spaced vertical lines within the
handle view to give a more traditional gripper appearance. We draw lines as 1pt
wide UIViews.
Now we just need to add these handles to the range selector in the annotation manager. We add some ivars to keep hold of them:
@interface ShinobiRangeAnnotationManager ()<UIGestureRecognizerDelegate> {
    ...
    SChartAnnotation *leftGripper, *rightGripper;
}
@end
And then we can create instances of them and add them to the chart:
- (void)createAnnotations
{
    ...
    // Create the handles
    leftGripper = [[ShinobiRangeHandleAnnotation alloc] initWithFrame:CGRectMake(0, 0, 30, 80) colour:[UIColor colorWithWhite:0.2 alpha:1.f] xValue:chart.xAxis.axisRange.minimum xAxis:chart.xAxis yAxis:chart.yAxis];
    rightGripper = [[ShinobiRangeHandleAnnotation alloc] initWithFrame:CGRectMake(0, 0, 30, 80) colour:[UIColor colorWithWhite:0.2 alpha:1.f] xValue:chart.xAxis.axisRange.maximum xAxis:chart.xAxis yAxis:chart.yAxis];

    ...
    // Add the handles on top so they take gesture priority.
    [chart addAnnotation:leftGripper];
    [chart addAnnotation:rightGripper];
}
And then, in the same way we added a gesture recogniser to the selected region annotation, we can add one to each of the grippers:
- (void)prepareGestureRecognisers
{
    ...
    // And pan gesture recognisers for the 2 handles on the range selector
    UIPanGestureRecognizer *leftGripperRecogniser = [[UIPanGestureRecognizer alloc] initWithTarget:self action:@selector(handleGripperPan:)];
    [leftGripper addGestureRecognizer:leftGripperRecogniser];
    UIPanGestureRecognizer *rightGripperRecogniser = [[UIPanGestureRecognizer alloc] initWithTarget:self action:@selector(handleGripperPan:)];
    [rightGripper addGestureRecognizer:rightGripperRecogniser];
}
We you can see we’ve added a new method to handle the dragging of the handles:
- (void)handleGripperPan:(UIPanGestureRecognizer*)recogniser
{
    CGPoint currentTouchPoint = [recogniser locationInView:chart.canvas];

    // What's the new location we've dragged the handle to?
    double newValue = [[chart.xAxis estimateDataValueForPixelValue:currentTouchPoint.x] doubleValue];

    SChartRange *newRange;
    // Update the range with the new value according to which handle we dragged
    if(recogniser.view == leftGripper) {
        // Left handle => change the range minimum
        newRange = [[SChartRange alloc] initWithMinimum:@(newValue) andMaximum:rightGripper.xValue];
    } else {
        // Right handle => change the range maximum
        newRange = [[SChartRange alloc] initWithMinimum:leftGripper.xValue andMaximum:@(newValue)];
    }

    // Move the selector
    [self moveRangeSelectorToRange:newRange];

    // And fire the delegate method
    [self callRangeDidMoveDelegateWithRange:newRange];
}
This method does much the same as the handlePan: method we created for when
dragging the entire selector:
- We find the current touch point and perform the same magic as before to establish what data value this pixel value represents
- Then we decide which of our grippers we have moved, and from this create the
updated
SChartRangewe should be displaying. - A call to the
moveRangeSelectorToRange:method will ensure we move all the annotations to the updated location. In this instance we’re actually asking it to resize the selected region and one of the shaded regions, and to move one of the lines and the grippers. - Finally we need to make a call to the delegate method so that the main chart can update itself as well.
Because of the way we built up the manager, this process is actually pretty simple - we’ve got methods to move the selector and inform the delegate.
Moving on
We’ve now got a range selector which can update the main chart both by dragging it, and by dragging the custom gripper annotations we’ve created at the end. This is starting to get pretty good, but there are still some things we want to work on. Firstly, it’s currently possible to drag the upper range selector gripper to below the lower. This causes the main chart to start complaining that it can’t display a range where the maximum is lower than the minimum. We’ll fix this bug in the next post.
The other thing we’ll look at is adding momentum to the selector drag motion - this is something we come to expect from iOS controls, and you can see that it works really well when you interact with the main chart. Currently however, when you let go of the range selector it stops dead, so we will build a momentum animation to improve the user experience.
You can read part III here.
Update 2013/03/10
Edited the post to remove the use of internal methods from the ShinobiCharts framework. This matches the updates to the codebase in the repository.