Building a range selector with ShinobiCharts: Part I - Linking 2 charts
This tutorial is also available on the ShinobiControls blog. You’ll find better support and assistance on this site as part of ShinobiDeveloper
When I’m not hacking around with electronics and code, I work for ShinobiControls, and we make really cool iOS UI components, including mega-tastic charts, grids and some general purpose components essential for any discerning iOS developer. However, that’s enough of the advertising (although, it is worth a look - just have a browse of shinobicontrols.com).
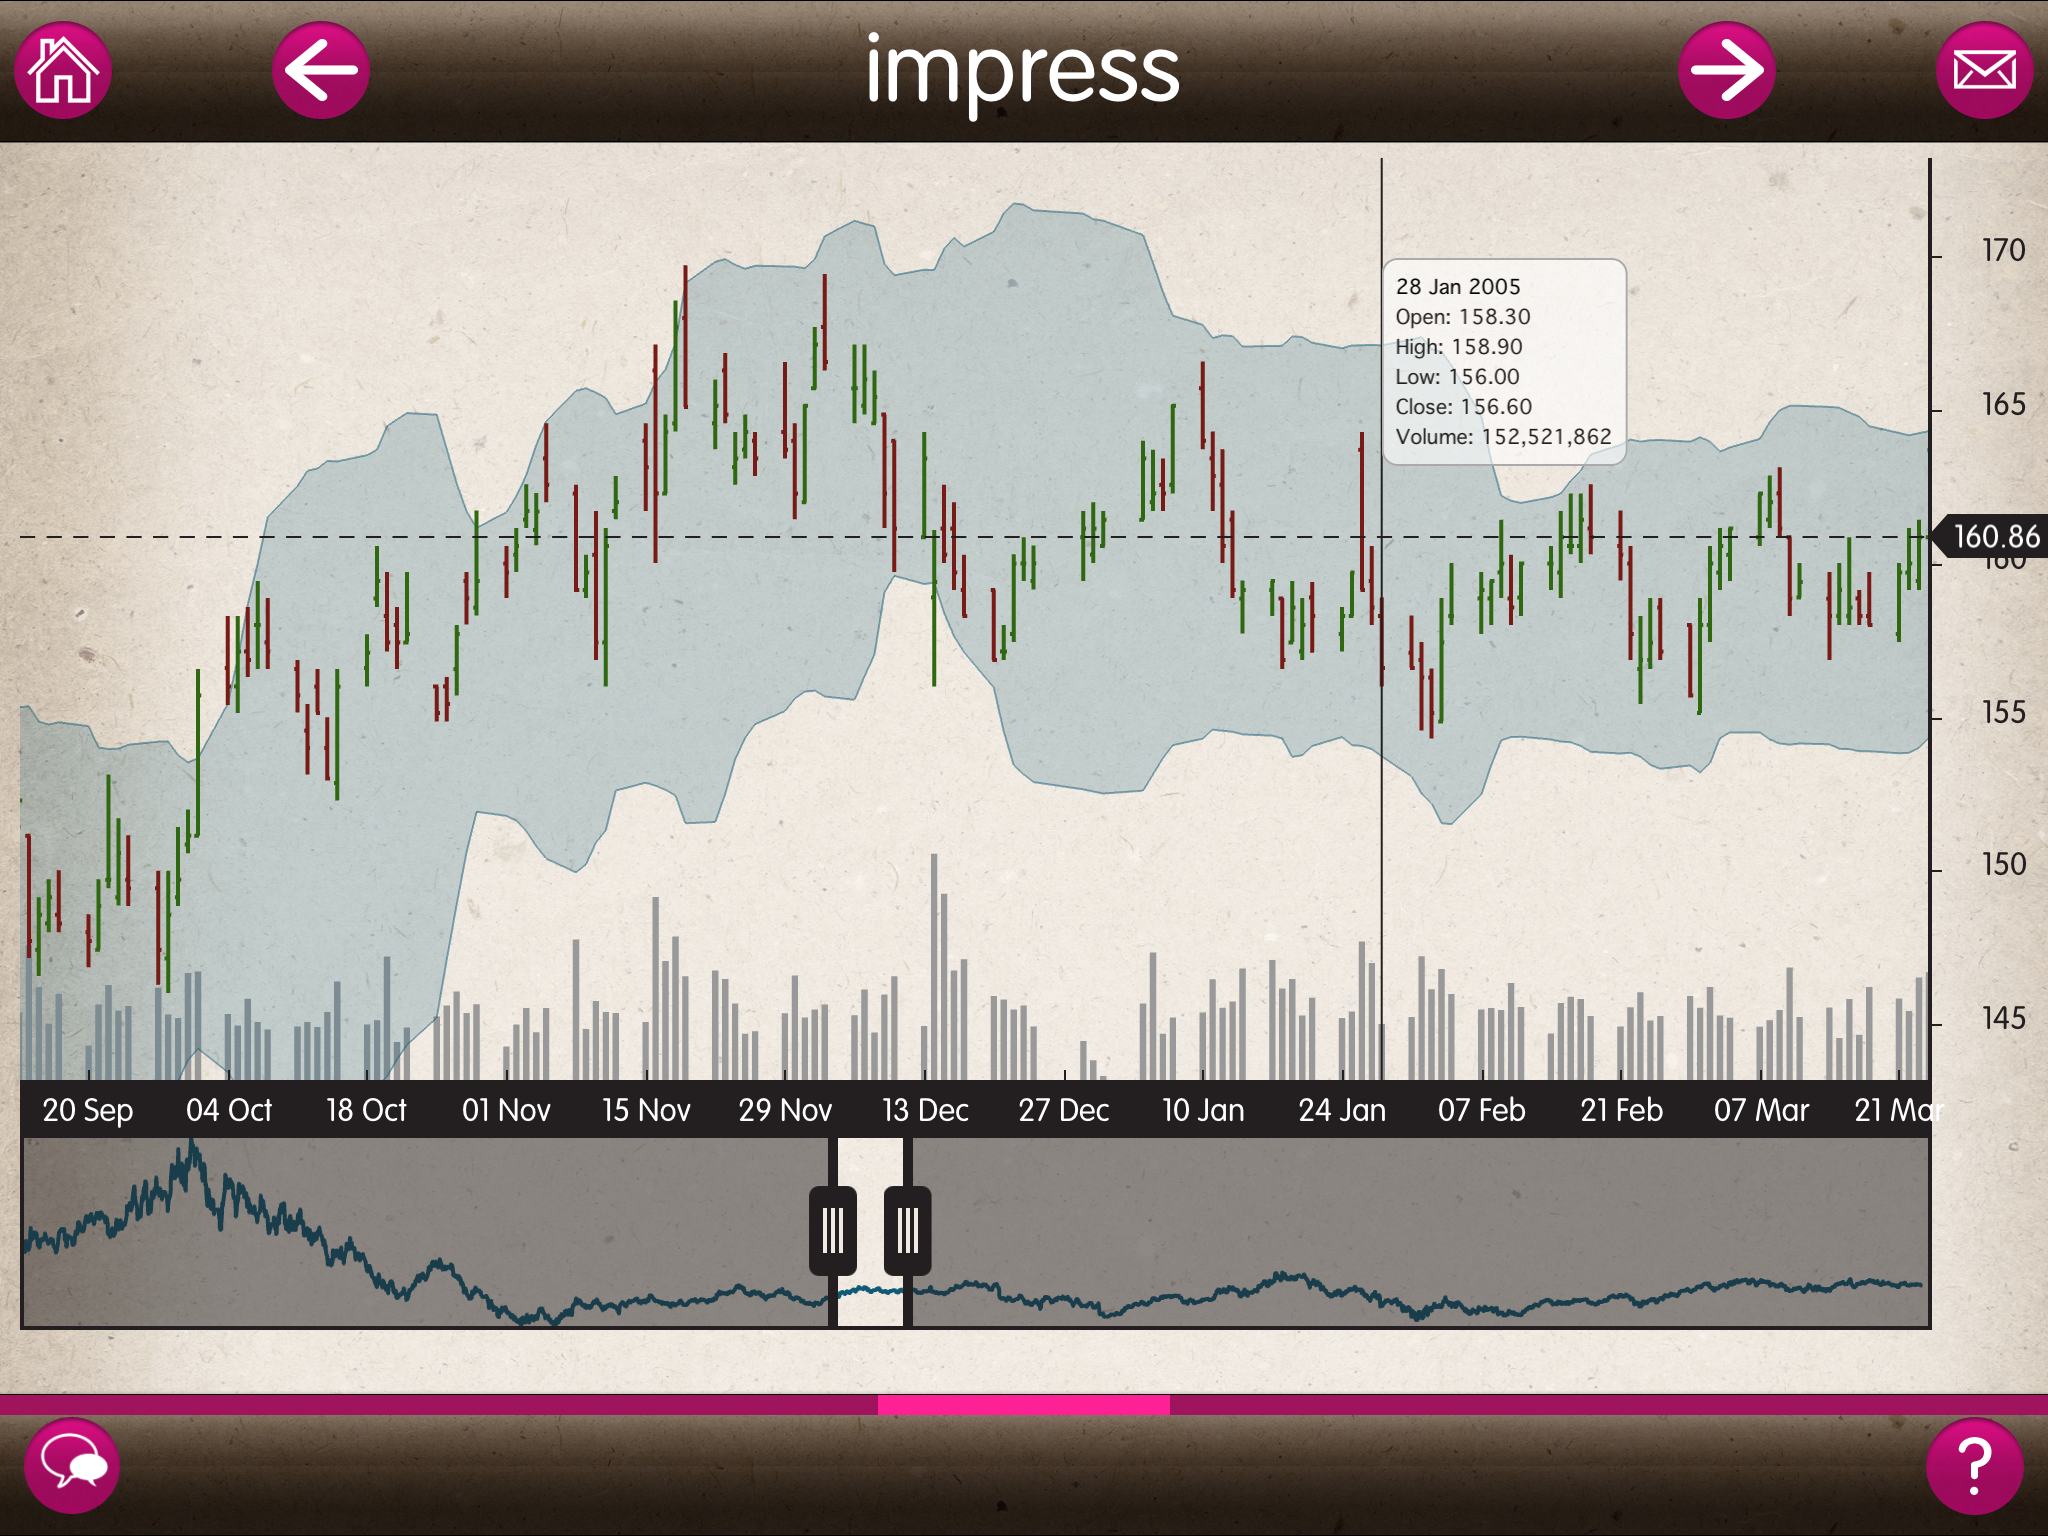
One of the projects I have been involved in is building ShinobiPlay - which is an iPad app available from the app store which provides a developer using Shinobi a handy set of tools, together with showcasing what the controls are capable of. One of the most popular demos is called “impress”, which is a chart of a financial data set. It has a collection of custom-rolled advanced features which are possible due to the power of Shinobi.
This short series of blog posts is going to run through the technical challenges associated with these advanced features. I’ll present these challenges as a sequence of requirements:
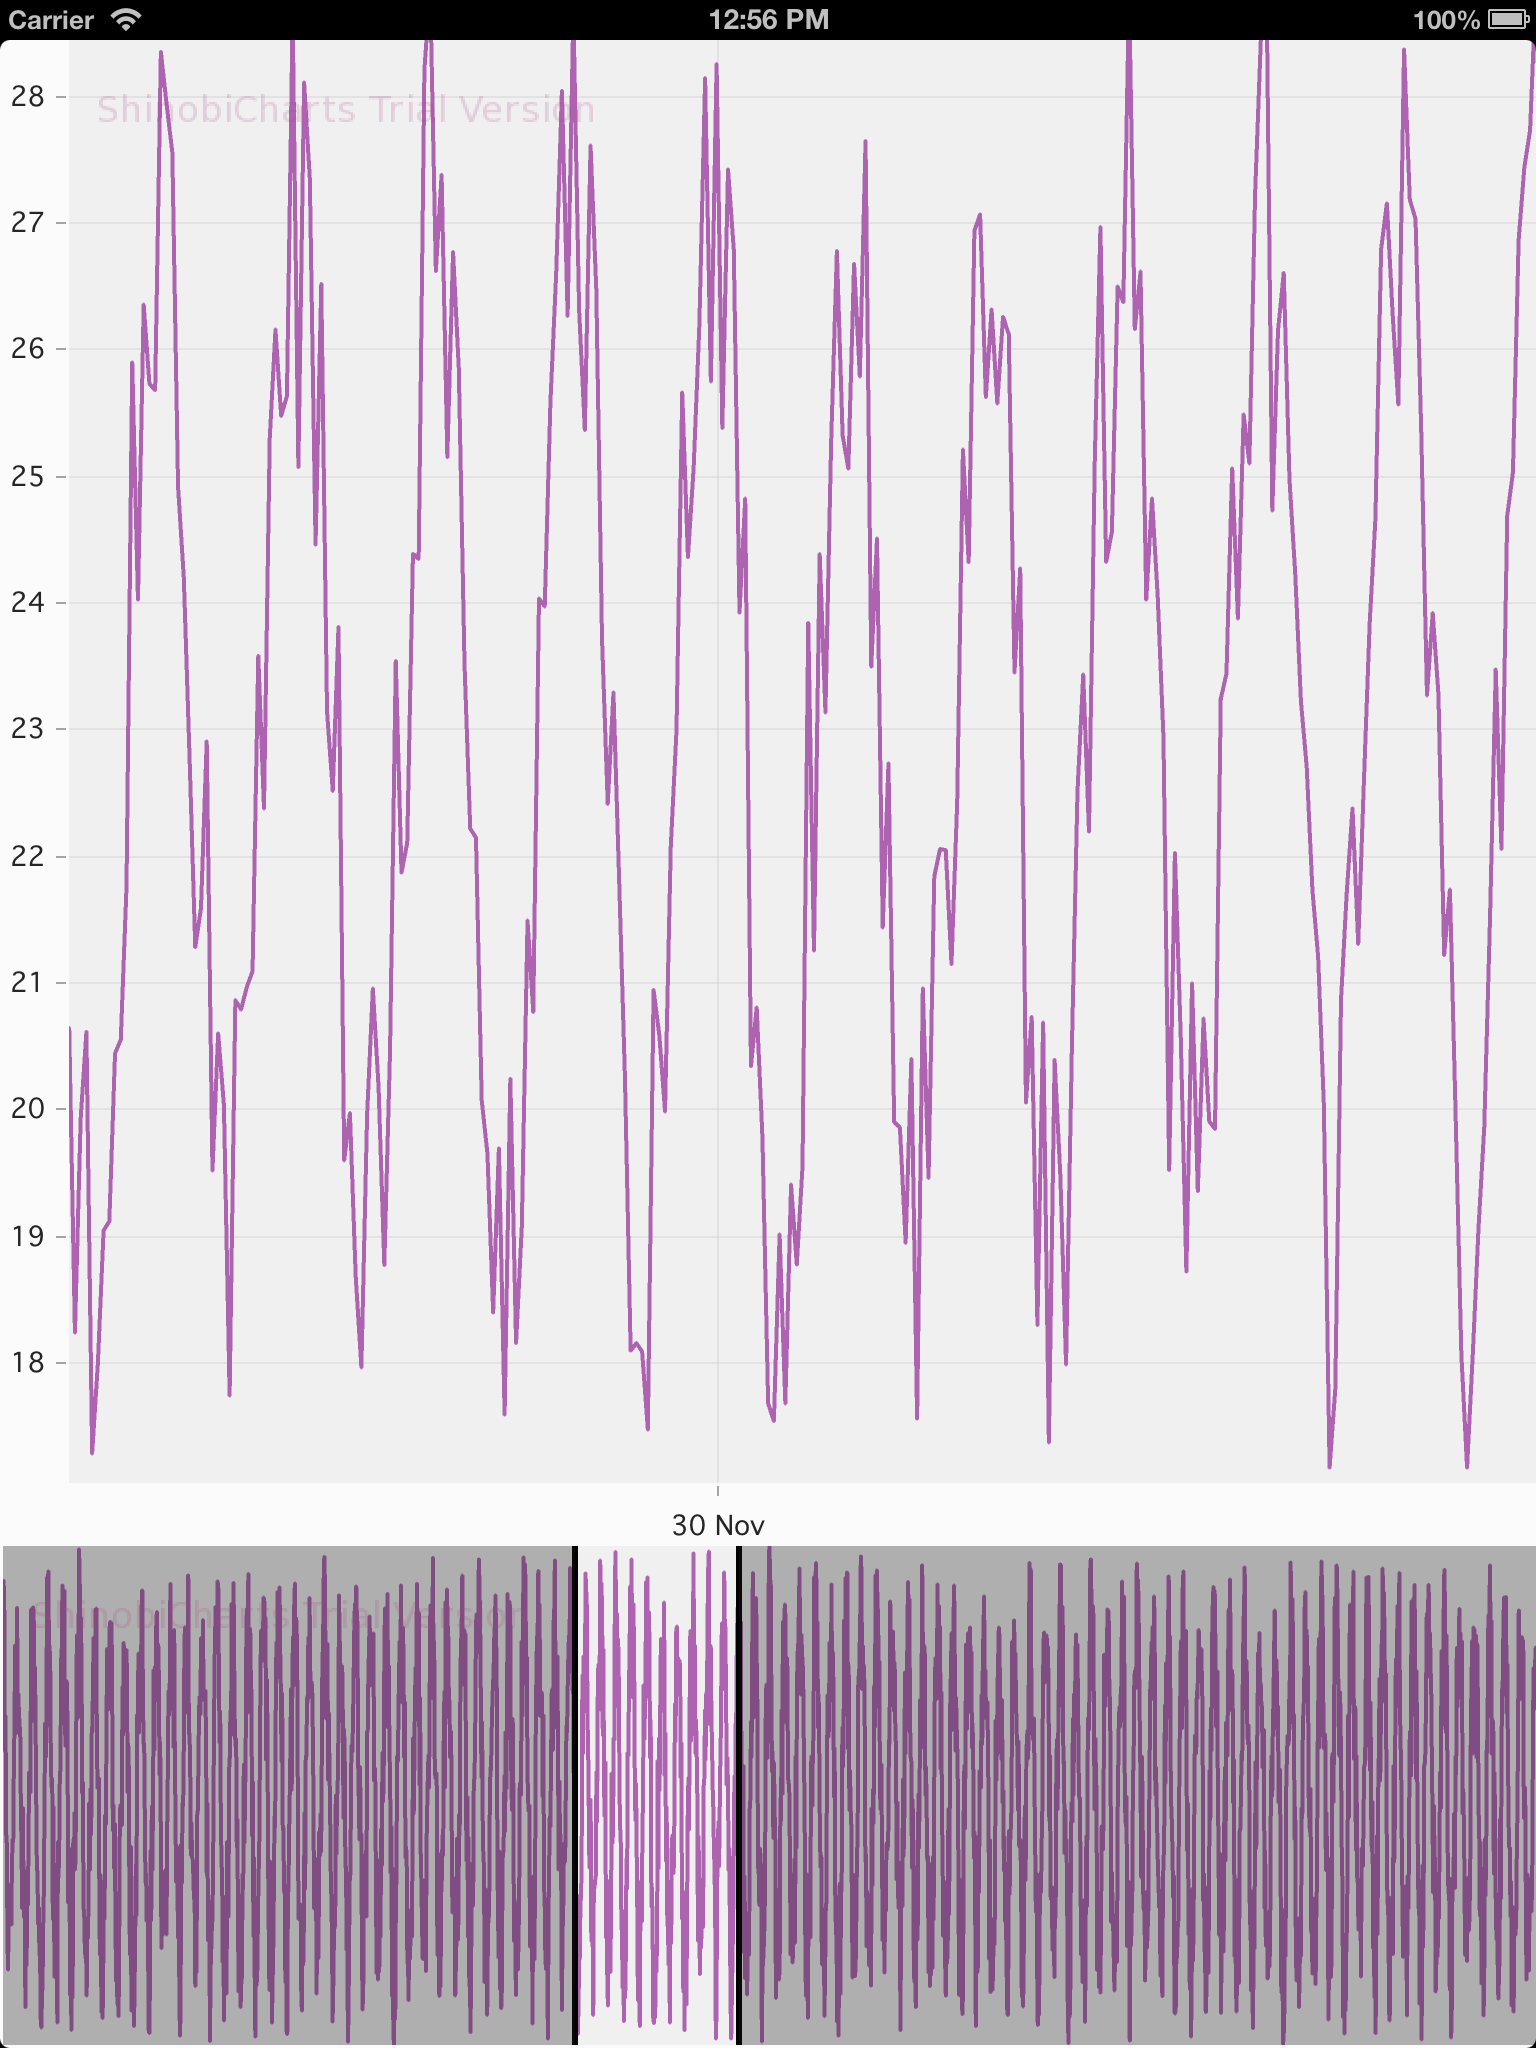
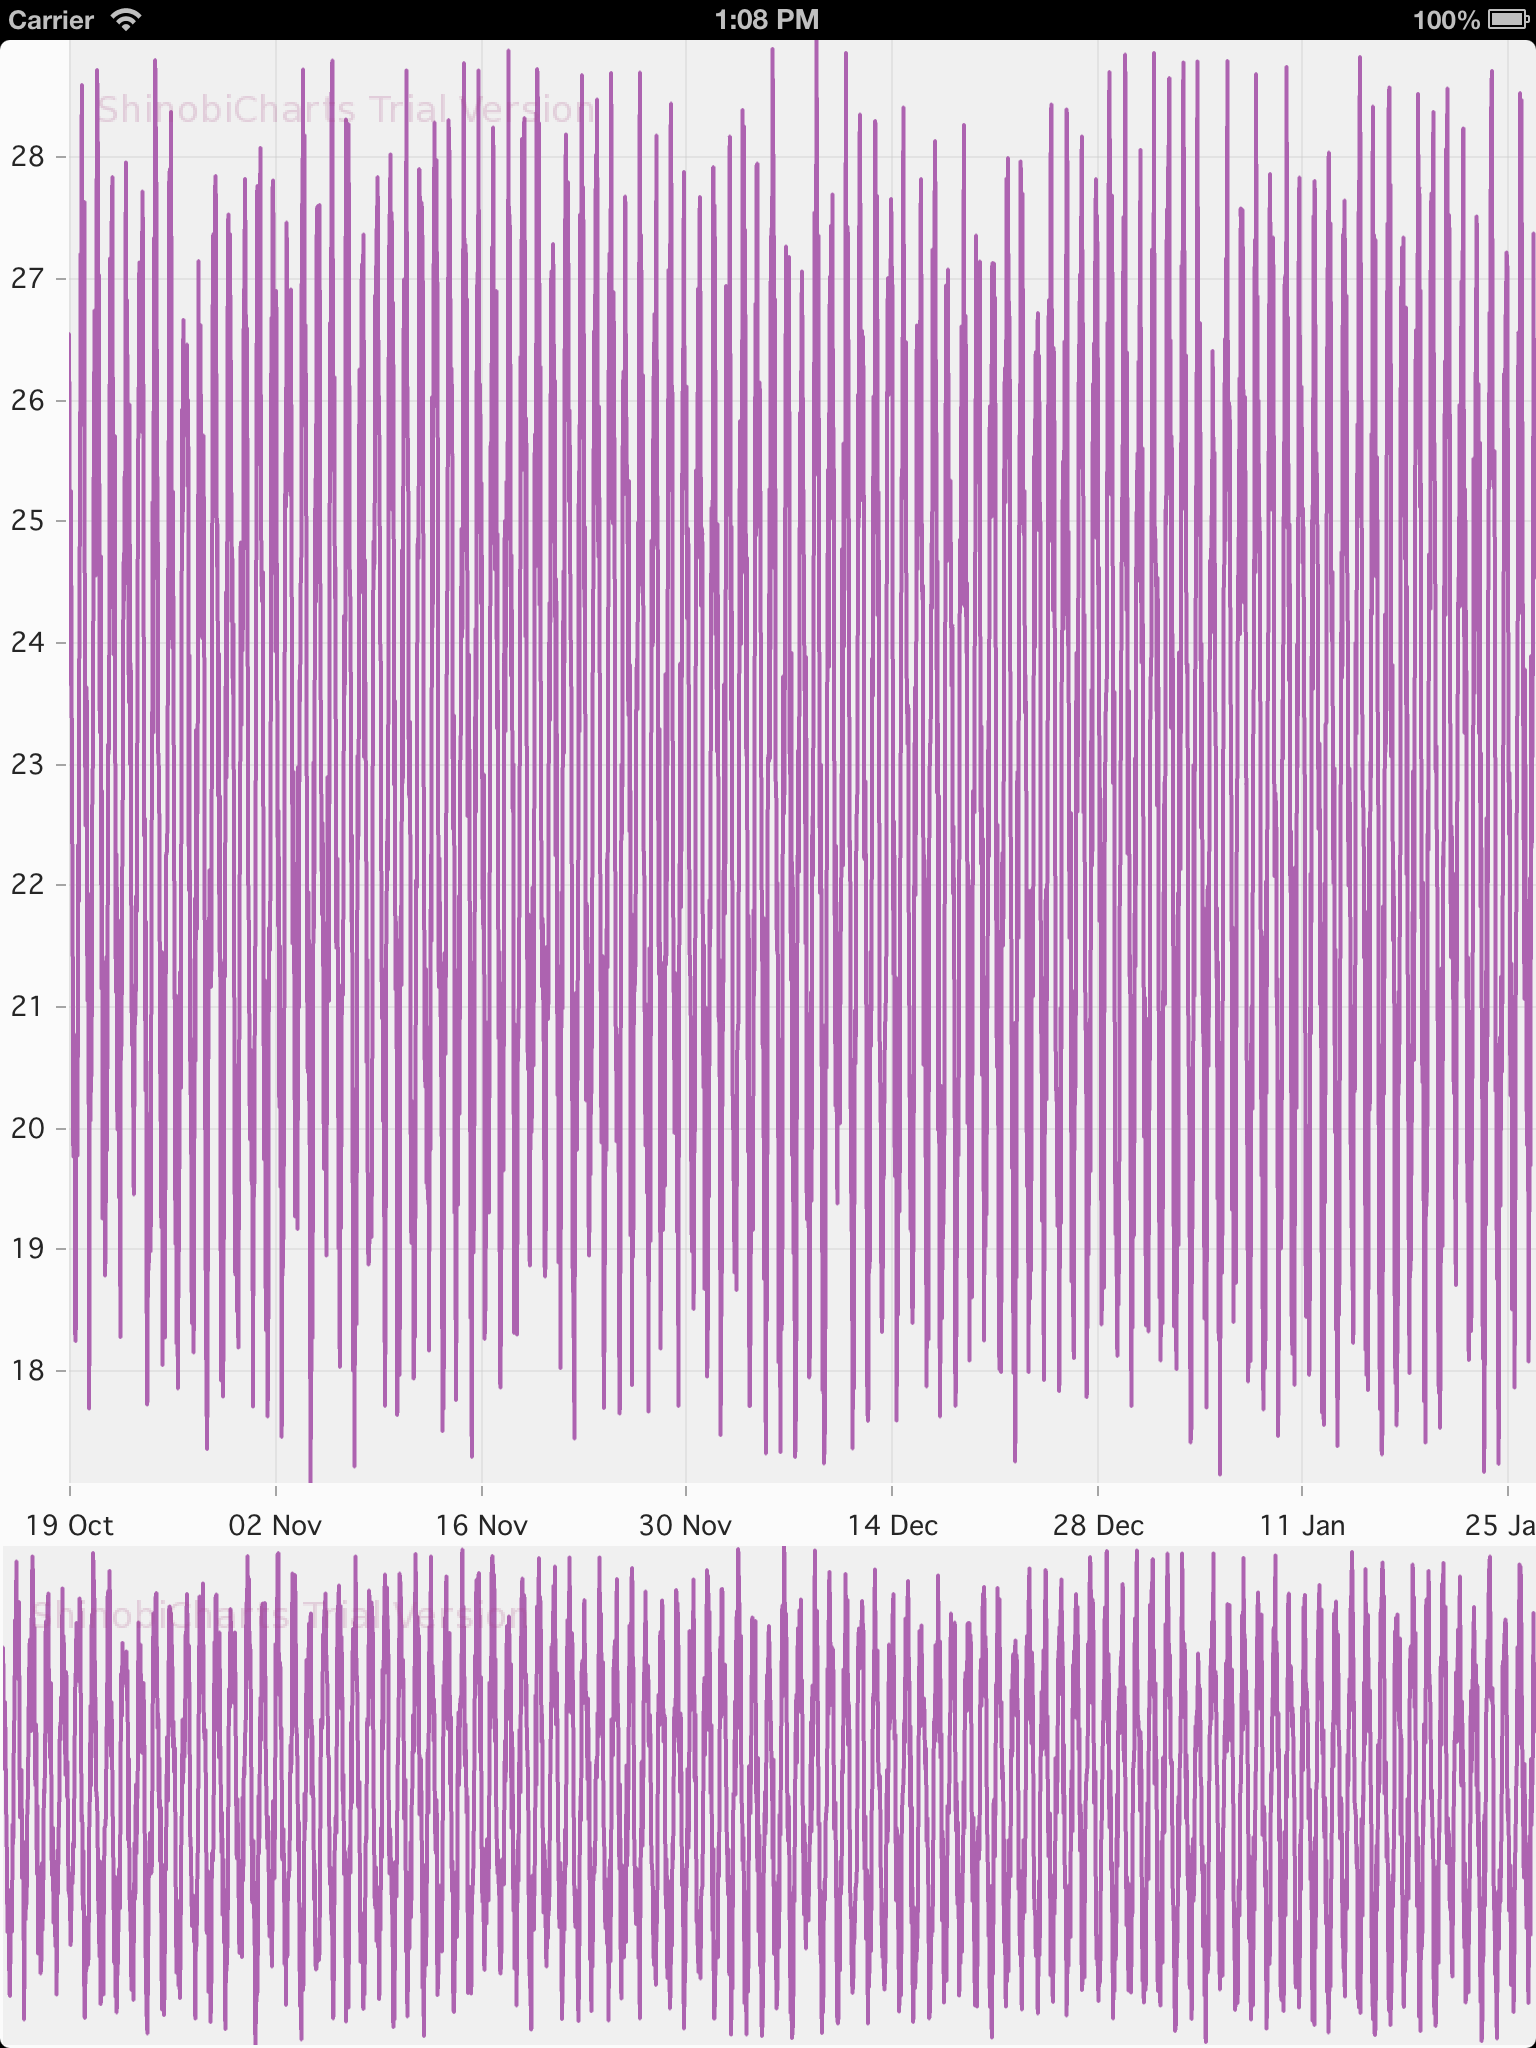
- Creating a ‘range selector’. The view is comprised of 2 charts - one shows a summary of the data, and as such shows the entire data range, superimposed over which is a ‘range selector window’. The primary chart shows just the data within this range. Navigating the main chart should update the range selector chart.
- Adding interaction with the range selector. Dragging the range selector should update the display in the main chart.
- The ends of the range selector should have handles which, when moved, update the range displayed in the main chart.
- Dragging the range selector should exhibit momentum.
- The main chart should have a horizontal line and text annotation which tracks the right-most point of the currently visible data.
As you can see, we’re going to tackle quite a lot of bits and pieces, so I’ve split the project into different posts. In this first post we’re going to build the simplest first iteration of the range selector - by getting 2 charts to ‘talk to each other’.
As ever, the code for the completed project is available on GitHub. It was written in almost the same order as the write-up, so you can almost follow commit-by-commit. In order to use Shinobi, you’ll have to get yourself a 30 day free trial of ShinobiCharts
- available on the website.
It’s not really the point of this blog series to talk about getting started with ShinobiCharts, and therefore we’ll breeze through the initial set up of the data source and the charts themselves.
The data layer
I want some time-series data for this project, and since I started writing the code
on a plane, I didn’t have access to any. Therefore I’ve put together a really simple
temperature data simulation. At the data access level, I’ve created a
TemperatureDataPoint class which has 2 properties - temperature and
timestamp:
@interface TemperatureDataPoint : NSObject

@property (nonatomic, strong) NSDate   *timestamp;
@property (nonatomic, strong) NSNumber *temperature;

- (id)initWithDate:(NSDate*)date temperature:(NSNumber*)temperature;

@end
The data layer is managed completely separately from any charting code. Although
in this particular app it wouldn’t be too much of a problem, it’s good practice
to keep a good separation. Therefore we create a singleton to manage an array of
TemperatureDataPoints:
@interface TemperatureData : NSObject

@property (nonatomic, strong) NSArray *data;

+ (TemperatureData*)sharedInstance;

@end
This class is is created with the recommended objective-c singleton pattern, and
overrides the init method to call an importData method. We use this method
to generate our simulated temperature data:
#pragma mark - Singleton initialisation
+ (TemperatureData *)sharedInstance
{
    static TemperatureData *sharedData = nil;
    static dispatch_once_t onceToken;
    dispatch_once(&onceToken, ^{
        sharedData = [[self alloc] init];
    });
    return sharedData;
}

#pragma mark - Initialisation
- (id)init
{
    self = [super init];
    if (self) {
        [self importData];
    }
    return self;
}

- (void)importData
{
    NSDate *startDate = [NSDate dateWithTimeIntervalSinceNow:-60*60*24*100];
    NSDate *endDate   = [NSDate date];

    // Some fixed properties for data generation
    double mean = 23;
    double dailyDelta = 4;
    double randomVariance = 2;

    NSMutableArray *data = [NSMutableArray array];

    NSDate *currentDate = startDate;
    while ([currentDate compare:endDate] == NSOrderedAscending) {
        // Sine wave based on time of date
        NSDateComponents *cmpts = [[NSCalendar currentCalendar] components:NSHourCalendarUnit fromDate:currentDate];
        double dayProportion = cmpts.hour / 24.f;
        double newValue = mean + dailyDelta * sin((dayProportion - 0.25) * 2 * M_PI);

        // And now add some randomness
        newValue += (arc4random() % 4096  / 2048.f - 1.f) * randomVariance;

        // Create a data point wih these values
        TemperatureDataPoint *dp = [[TemperatureDataPoint alloc] initWithDate:currentDate temperature:@(newValue)];
        [data addObject:dp];

        // Move the current date on by an hour
        currentDate = [NSDate dateWithTimeInterval:3600 sinceDate:currentDate];
    }

    // Save this off into our ivar
    self.data = [NSArray arrayWithArray:data];
}
Plotting basic charts
Now that we have created some sample data, we need to plot 2 charts. We could just
go straight ahead and create some charts within the view controller, but I’d like
to aim to create something a little more reusable than that, so I’ll create a
ShinobiRangeSelector UIView subclass, which will create and manage the two
charts together. In this instance we’ll assume that both charts will use the same
datasource (not always going to be true) and that we want to arrange them vertically.
We only need one external method on the API for now:
@interface ShinobiRangeSelector : UIView

- (id)initWithFrame:(CGRect)frame datasource:(id<SChartDatasource>)datasource splitProportion:(CGFloat)proportion;

@end
The frame is as one would expect for a UIView subclass, the datasource is the
data source the two charts share, and the splitProportion determines how much
of the view should be allocated to the main chart and how much to the range selector
chart.
We create ivars for the datasource and the two separate charts, and then in our
custom constructor, we save off the data source and calculate the frames of the
two charts, based on the frame we have been provided, and the splitProportion:
@interface ShinobiRangeSelector () {
    id<SChartDatasource> chartDatasource;
    ShinobiChart *mainChart;
    ShinobiChart *rangeChart;
}
@end

@implementation ShinobiRangeSelector

- (id)initWithFrame:(CGRect)frame datasource:(id<SChartDatasource>)datasource splitProportion:(CGFloat)proportion
{
    self = [super initWithFrame:frame];
    if (self) {
        // Initialization code
        chartDatasource = datasource;

        // Calculate the frame sizes of the 2 charts we want to create
        CGRect mainFrame = self.bounds;
        mainFrame.size.height *= proportion;
        CGRect rangeFrame = self.bounds;
        rangeFrame.size.height -= mainFrame.size.height;
        rangeFrame.origin.y = mainFrame.size.height;

        // Create the 2 charts
        [self createMainChartWithFrame:mainFrame];
        [self createRangeChartWithFrame:rangeFrame];
    }
    return self;
}
@end
We have created a couple of utility methods to create the actual charts themselves.
These methods are very much ShinobiCharts boiler-plate code - create a chart,
pass in the license key (demo users only), assign the datasource, configure any
additional functionality, and then add the chart as a subview to a UIView (in
this case ourself):
- (void)createMainChartWithFrame:(CGRect)frame
{
    mainChart = [[ShinobiChart alloc] initWithFrame:frame withPrimaryXAxisType:SChartAxisTypeDateTime withPrimaryYAxisType:SChartAxisTypeNumber];
    mainChart.licenseKey = [ShinobiLicense getShinobiLicenseKey];
    mainChart.datasource = chartDatasource;

    // Prepare the axes
    [ChartConfigUtilities setInteractionOnChart:mainChart toEnabled:YES];

    [self addSubview:mainChart];
}

- (void)createRangeChartWithFrame:(CGRect)frame
{
    rangeChart = [[ShinobiChart alloc] initWithFrame:frame withPrimaryXAxisType:SChartAxisTypeDateTime withPrimaryYAxisType:SChartAxisTypeNumber];
    rangeChart.licenseKey = [ShinobiLicense getShinobiLicenseKey];
    rangeChart.datasource = chartDatasource;

    // Prepare the axes
    [ChartConfigUtilities setInteractionOnChart:rangeChart toEnabled:NO];
    // Remove the axis markings
    [ChartConfigUtilities removeAllAxisMarkingsFromChart:rangeChart];

    [self addSubview:rangeChart];
}
These 2 methods are pretty similar - although the main chart has user interaction (i.e. the ability to pan and zoom) enabled, whereas the range chart doesn’t - we want the interaction on the range chart to be with the range selector, not the chart itself. We also remove all the axis markings from the range chart - this isn’t necessary, and is a stylistic choice - it makes for a cleaner looking UI.
In order to pull out some repetitive code here, we’ve made a couple of helper classes:
ShinobiLicense, which is a class to assist with managing the license key. In my implementation I saved the licence key into a plist and this class pulls the string out of there and returns it. Alternatively, you can just copy-paste your license code into the class itself (it’s pretty self-explanatory) when you look at the code in the repo.ChartConfigUtilities: which pulls out some common functionality for configuring a chart when you have created it:
@interface ChartConfigUtilities : NSObject

+ (void)setInteractionOnChart:(ShinobiChart*)chart toEnabled:(BOOL)enabled;

+ (void)removeAllAxisMarkingsFromChart:(ShinobiChart*)chart;
+ (void)removeMarkingsFromAxis:(SChartAxis*)axis;
+ (void)removeLinesOnStripesFromAxis:(SChartAxis*)axis;
+ (void)removeTitleFromAxis:(SChartAxis*)axis;

@end
The methods are all pretty self-explanatory - there is nothing clever going on here. This is however, boiler-plate code that I find myself using nearly every time I create a ShinobiChart, and therefore I use this class over and over again:
@implementation ChartConfigUtilities

#pragma mark - User interaction
+ (void)setInteractionOnChart:(ShinobiChart *)chart toEnabled:(BOOL)enabled
{
    for (SChartAxis *axis in chart.allAxes) {
        axis.enableGesturePanning  = enabled;
        axis.enableGestureZooming  = enabled;
        axis.enableMomentumPanning = enabled;
        axis.enableMomentumZooming = enabled;
    }
}

#pragma mark - Axis Markings
+ (void)removeAllAxisMarkingsFromChart:(ShinobiChart *)chart
{
    for (SChartAxis *axis in chart.allAxes) {
        [self removeLinesOnStripesFromAxis:axis];
        [self removeMarkingsFromAxis:axis];
        [self removeTitleFromAxis:axis];
    }
}

+ (void)removeMarkingsFromAxis:(SChartAxis *)axis
{
    axis.style.majorTickStyle.showLabels = NO;
    axis.style.majorTickStyle.showTicks  = NO;
    axis.style.minorTickStyle.showLabels = NO;
    axis.style.minorTickStyle.showTicks  = NO;
}

+ (void)removeLinesOnStripesFromAxis:(SChartAxis *)axis
{
    axis.style.majorGridLineStyle.showMajorGridLines = NO;
    axis.style.gridStripeStyle.showGridStripes = NO;
}

+ (void)removeTitleFromAxis:(SChartAxis *)axis
{
    axis.title = @"";
}
@end
Chart Datasource
So we’ve now created a UIView subclass which, when provided with a suitable
datasource, will draw 2 charts. Although we have created a singleton class
to manage our data, we haven’t created a class which implements the
SChartDatasource protocol - i.e. the chart datasource. This is standard
ShinobiChart stuff:
@interface ChartDatasource : NSObject <SChartDatasource>
@end
And in the implementation, we grab hold of a reference to our shared data store
and then implement the required SChartDatasource protocol methods by mapping
from our data store to the structures required for a ShinobiChart:
@interface ChartDatasource () {
    TemperatureData *temperatureData;
}
@end

@implementation ChartDatasource
- (id)init
{
    self = [super init];
    if (self) {
        temperatureData = [TemperatureData sharedInstance];
    }
    return self;
}

#pragma mark - SChartDatasource methods
- (int)numberOfSeriesInSChart:(ShinobiChart *)chart
{
    return 1;
}

- (SChartSeries *)sChart:(ShinobiChart *)chart seriesAtIndex:(int)index
{
    return [[SChartLineSeries alloc] init];
}

- (int)sChart:(ShinobiChart *)chart numberOfDataPointsForSeriesAtIndex:(int)seriesIndex
{
    return temperatureData.data.count;
}

- (NSArray *)sChart:(ShinobiChart *)chart dataPointsForSeriesAtIndex:(int)seriesIndex
{
    NSMutableArray *datapointArray = [NSMutableArray array];
    for (TemperatureDataPoint *tdp in temperatureData.data) {
        SChartDataPoint *dp = [SChartDataPoint new];
        dp.xValue = tdp.timestamp;
        dp.yValue = tdp.temperature;
        [datapointArray addObject:dp];
    }
    return [NSArray arrayWithArray:datapointArray];
}
@end
We’ve now created all the bits so that we can plot the 2 charts really simply. There is a lot of ground work here, but it’ll make all the upcoming clever stuff a lot easier to implement now it’s nicely designed.
Therefore, in our app’s view controller, it’s as simple as this to display our two charts:
@interface ViewController () {
    ChartDatasource *datasource;
    ShinobiRangeSelector *rangeSelector;
}
@end

@implementation ViewController
- (void)viewDidLoad
{
    [super viewDidLoad];
    // Do any additional setup after loading the view, typically from a nib.
    datasource = [[ChartDatasource alloc] init];
    rangeSelector = [[ShinobiRangeSelector alloc] initWithFrame:self.view.bounds datasource:datasource splitProportion:0.75f];

    [self.view addSubview:rangeSelector];
}
@end
We define some ivars to keep hold of our range selector view, and our data source. Then we create these two objects, specifying that we want the main chart to be three times the height of the range chart, and that we want the entire view to fill the view controller’s view. Really simple, clean view controller. It’s worth planning ahead like this, to avoid the massive, sprawling view controllers that evolve. Well, ‘planning ahead’ and refactoring…
Annotations
So far all we’ve actually achieved is plotting 2 charts from a shared datasource
- that’s hardly difficult. Now we need to start doing some clever stuff - firstly we’ll build the range selector on the range chart, and then get it to move as the user interacts with the main chart.
If you want to draw on top of ShinobiCharts you can can use standard UIKit
techniques. However, if you want to draw in the chart’s data coordinate system
(i.e. at particular values of x and y) Shinobi provides the SChartAnnotation
class. Since this is exactly what we need to do with the range selector, we will
use annotations to place the constituent parts in the correct places.
We’re going to create a class to manage the range selector annotations, which
we’ll call ShinobiRangeAnnotationManager. For now it has a simple interface,
although we’ll add a few bits and pieces as we continue:
@interface ShinobiRangeAnnotationManager : NSObject
- (id)initWithChart:(ShinobiChart *)chart;
@end
We add some private ivars in the implementation file - one for the chart and then some for the annotations which will make up the range selector. We’re going to construct it out of some simple parts. The central section (i.e. the selected range itself) doesn’t yet need an annotation (although it will later) as it is a transparent block. This region will be bounded by vertical lines, and these will be surrounded by shaded regions which will stretch to the extent of the chart.
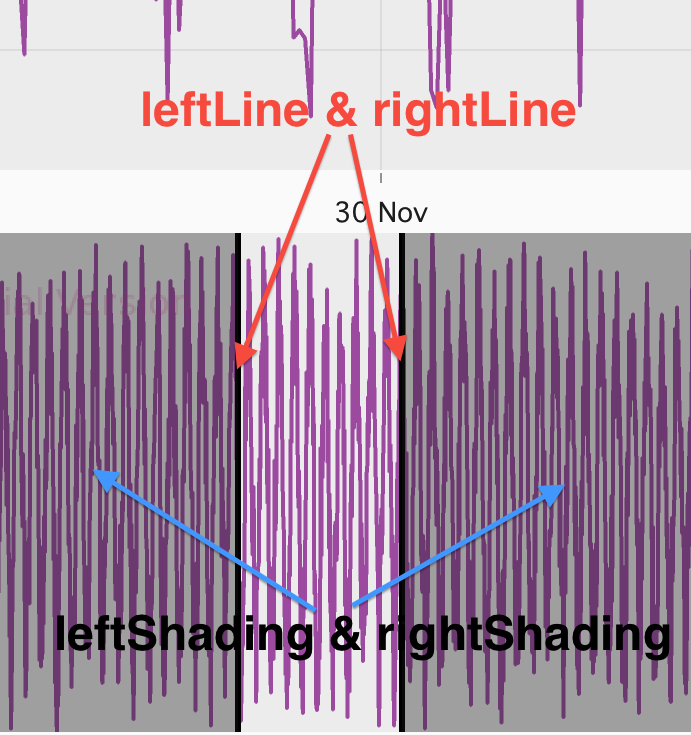
Each of these 4 annotations will be an ivar so we can update their size and position when required:
@interface ShinobiRangeAnnotationManager ()<UIGestureRecognizerDelegate> {
    ShinobiChart *chart;
    SChartAnnotation *leftLine, *rightLine;
    SChartAnnotationZooming *leftShading, *rightShading;
}

@end

@implementation ShinobiRangeAnnotationManager

#pragma mark - Constructors
- (id)init
{
    NSException *exception = [NSException exceptionWithName:NSInvalidArgumentException reason:@"Please use initWithChart:" userInfo:nil];
    @throw exception;
}

- (id)initWithChart:(ShinobiChart *)_chart
{
    self = [super init];
    if(self) {
        chart = _chart;
        [self createAnnotations];
    }
    return self;
}
@end
As you can see, we override the default constructor to throw an exception, as we
never want a user to be able to create a range selector without providing a chart.
You might notice that the line annotations are of type SChartAnnotation, whereas
the shaded regions are of SChartAnnotationZooming. This is due to the behaviour
we want - so-called ‘zooming’ annotations are anchored to 2 points on the axis,
whereas the non-zooming variety have only one anchor point. The ‘zooming’ name
comes from how they behave when the chart undergoes zooming operations, which isn’t
relevant in our case because the range chart has zooming disabled.
We then implement our custom constructor, which saves off the chart, and then calls a method to create the annotations:
#pragma mark - Manager setup
- (void)createAnnotations
{
    // Lines are pretty simple
    leftLine = [SChartAnnotation verticalLineAtPosition:nil withXAxis:chart.xAxis andYAxis:chart.yAxis withWidth:3.f withColor:[UIColor colorWithWhite:0.2 alpha:1.f]];
    rightLine = [SChartAnnotation verticalLineAtPosition:nil withXAxis:chart.xAxis andYAxis:chart.yAxis withWidth:3.f withColor:[UIColor colorWithWhite:0.2 alpha:1.f]];
    // Shading is either side of the line
    leftShading = [SChartAnnotation verticalBandAtPosition:chart.xAxis.axisRange.minimum andMaxX:nil withXAxis:chart.xAxis andYAxis:chart.yAxis withColor:[UIColor colorWithWhite:0.1f alpha:0.3f]];
    rightShading = [SChartAnnotation verticalBandAtPosition:nil andMaxX:chart.xAxis.axisRange.maximum withXAxis:chart.xAxis andYAxis:chart.yAxis withColor:[UIColor colorWithWhite:0.1f alpha:0.3f]];

    // Add the annotations to the chart
    [chart addAnnotation:leftLine];
    [chart addAnnotation:rightLine];
    [chart addAnnotation:leftShading];
    [chart addAnnotation:rightShading];
}
We are using standard factory methods provided by SChartAnnotation, and since
we don’t yet have values for where to position them, we can pass in sensible
defaults.
In order to actually draw these annotations, we need to add an annotation manager
to the ShinobiRangeSelector and set it up correctly:
@interface ShinobiRangeSelector () {
    ...
    ShinobiRangeAnnotationManager *rangeAnnotationManager;
}

- (void)createRangeChartWithFrame:(CGRect)frame
{
    ...
    // Add some annotations
    rangeAnnotationManager = [[ShinobiRangeAnnotationManager alloc] initWithChart:rangeChart];
}
Responding to user interaction
The range selector doesn’t look like very much yet, but that’s because we haven’t
actually told it which range it should be displaying. Let’s do that now, by wiring
it up to the main chart in the ShinobiRangeSelector. First of all we need to
add a method to the API of the range annotation manager which will move the
range selector as required:
- (void)moveRangeSelectorToRange:(SChartRange *)range;- (void)moveRangeSelectorToRange:(SChartRange *)range
{
// Update the positions of all the individual components which make up the
// range annotation
leftLine.xValue = range.minimum;
rightLine.xValue = range.maximum;
leftShading.xValue = chart.xAxis.axisRange.minimum;
leftShading.xValueMax = range.minimum;
rightShading.xValue = range.maximum;
rightShading.xValueMax = chart.xAxis.axisRange.maximum;
// And finally redraw the chart
[chart redrawChart];
}Shinobi has provided us with the SChartRange class, which contins maximum
and minimum properties, and is used to specify ranges on axes. We provide a
method on the API of our annotation manager which accepts a range and then
redraws the annotations to highlight this specified range.
As mentioned before, the line annotations only require one x-value to determine where to position them, so we place one at the range maximum, and one at the minimum. The shaded regions require 2 values to render - so we use the x-axis extrema in combination with the provided range values to correctly place the regions.
In order to get the annotations to update positions it’s necessary to redraw the
chart by sending it an aptly named redraw message.
As a final piece to this mammoth first blog post on this project, we need to wire this API method into our main chart. Charts have delegate methods to let you know when a user is interacting with them - both zooming and panning will change the range so we need to listen for these.
First of all, we need to make the ShinobiRangeSelector a delegate of the main
chart:
@interface ShinobiRangeSelector : UIView <SChartDelegate>- (void)createMainChartWithFrame:(CGRect)frame
{
...
// We use ourself as the chart delegate to get zoom/pan details
mainChart.delegate = self;
}Then, we just need to implement the SChartDelegate methods we require:
#pragma mark - SChartDelegate methods
- (void)sChartIsPanning:(ShinobiChart *)chart withChartMovementInformation:(const SChartMovementInformation *)information
{
    [rangeAnnotationManager moveRangeSelectorToRange:chart.xAxis.axisRange];
}

- (void)sChartIsZooming:(ShinobiChart *)chart withChartMovementInformation:(const SChartMovementInformation *)information
{
    [rangeAnnotationManager moveRangeSelectorToRange:chart.xAxis.axisRange];
}
These methods are called as the chart is panned or zoomed, and we simply find out the current axis range on the main chart and pass it to the annotation manager so that it can update its display. It’s that simple!
Conclusion, and what’s next…
Phew - that was quite a lot of stuff. We’ve gone from nothing to an app which displays 2 charts of the same data - one of which allows user interaction, the other of which has a cool-looking range selection overlay, which updates as the user interacts with the primary chart. When you consider all that this is actually quite a short post!
However, there’s so much more we can do - at the moment, we can’t interact with the range selector - something we really want to do. Try it - if you fire up the app you instinctively want to play around with that range selector. So, next post we’ll fix that.
As I mentioned at the top, all the code is available on github at github.com/sammyd/Shinobi-RangeSelector. Grab that, and together with your demo of ShinobiCharts you can see how cool this is :)
Part II - creating custom handle annotations is available here.